Introduction
In our last lesson, we examined the market's mechanical underpinnings, exploring how forced buying and selling manifest as explosive short squeezes and liquidation cascades. You learned that some of the most dramatic price moves are not driven by fundamentals but by the plumbing of market structure—leverage, positioning, and liquidity.
Today, we begin translating that structural knowledge into a visual skill. We move from the "why" of price dislocations to the "what" and "when." This lesson introduces you to technical analysis, starting with its most fundamental tool: the candlestick chart. Your goal is to learn the basic grammar of price movement—support, resistance, breakouts, and reversals. Think of it as learning to read the footprints left on the chart by the very forces we discussed. By the end of this lesson, a price chart will no longer look like random noise but will begin to tell a story of supply and demand, conviction, and indecision.
The Anatomy of a Price Bar
Every chart, no matter how complex the pattern, is built from a single unit of information: the price bar or candlestick. Each candle is a visual summary of the battle between buyers and sellers over a specific period—be it one minute, one day, or one week.
To get a dynamic feel for how these are constructed, let's start with a video.
How to Read Candlestick Shapes & Charts (with ZERO experience)
The instructor in this Warrior Trading video, Ross Cameron, provides a clear, high-energy breakdown of how a candle is formed and what it represents. His style is very direct and aligns with the "operator" mindset.
Watch the following segments: Anatomy of a Candle: Pay close attention to the four key data points—Open, High, Low, and Close (OHLC)—and how they create the body and wicks. Time and Real-Time Formation: This section is crucial. Understand that until a candle "closes" (i.e., the time period ends), its shape is dynamic. This real-time evolution is what traders watch for immediate clues.
As the video explained, the four OHLC data points tell a story. Let's formalize what each one reveals.
Chart Reading Explained - Wyckoff Analytics
This article from Wyckoff Analytics provides a structured, professional take on the meaning behind each part of a price bar.
Read the section The Price Bar. Focus on the table that breaks down what each data point reveals. Note the emphasis on the Close; it's considered the most important price because it's where institutions mark their books and final sentiment is recorded.
The key insight is this: the body of the candle (the part between the open and close) represents conviction. A long green body shows strong buying conviction. A long red body shows strong selling conviction. The wicks (or shadows) represent the battle. A long upper wick shows that buyers tried to push the price up but were beaten back by sellers. A long lower wick shows sellers tried to push the price down but were overwhelmed by buyers.
Support & Resistance: The Market's Battlegrounds
If candlesticks show the moment-to-moment skirmishes, support and resistance levels show the major battlefields. These are not mystical lines; they are horizontal zones on the chart where the balance of power between buyers and sellers has previously shifted in a significant way. The market has memory, and these are the price levels it remembers.
- Support: A price zone where buying pressure has historically been strong enough to overcome selling pressure, causing a decline to halt and reverse. Think of it as a floor.
- Resistance: A price zone where selling pressure has historically been strong enough to overcome buying pressure, causing an advance to halt and reverse. Think of it as a ceiling.
Chart Reading Explained - Wyckoff Analytics
This text explains the logic behind why these levels form and why they matter.
Read the section titled Support and Resistance. Pay attention to two critical concepts: Why levels form: It's rooted in the psychology of traders who previously bought or sold at those prices. Role Reversal: The idea that once resistance is broken, it often becomes support on a subsequent retest, and vice-versa. This is a core principle of price action.
A crucial professional insight, mentioned in the reading, is that support and resistance are zones, not exact lines. Amateurs draw a thin line and declare the level broken if the price pokes through by a few ticks. Professionals understand that these are areas of confluence where they should expect a fight.
The Grammar of Price Movement
Now we can combine our understanding of candles and S/R zones to read the basic grammar of a chart. Price generally does one of three things: it trends up, it trends down, or it moves sideways.
- An uptrend is defined by a series of higher highs (HH) and higher lows (HL).
- A downtrend is defined by a series of lower highs (LH) and lower lows (LL).
- A sideways market or range is when price oscillates between a relatively clear support and resistance level.
The most important events on a chart happen when a trend either continues with force or reverses direction. These events—breakouts and reversals—tend to occur at support and resistance.

Reversals: A Change in Leadership
A reversal is a change in the dominant trend. They are often signaled by specific candlestick patterns appearing at a key support or resistance level, indicating that the prevailing momentum is exhausted and the opposing force is taking control.
How to Read Candlestick Shapes & Charts (with ZERO experience)
This video provides excellent visual explanations of the most common and powerful reversal patterns.
Focus on these key patterns: Doji, Gravestone Doji, and Dragonfly Doji: These are candles of pure indecision. A doji at the peak of an uptrend or bottom of a downtrend is a major red flag that the trend is losing steam. Hammer and Hanging Man: The Hammer is a bullish reversal pattern at a low, showing buyers "hammering out a bottom." Inverted Hammer and Shooting Star: The Shooting Star is a potent bearish reversal pattern at a high, showing a failed attempt to move higher. Tweezer Top/Bottom: Two consecutive candles with matching highs or lows, showing a strong rejection of a price level. Bullish/Bearish Engulfing: A very powerful two-candle pattern where a large candle completely "engulfs" the prior, smaller candle, signaling a decisive shift in control.
When you see one of these patterns form at a major support or resistance zone, you are witnessing a potential turning point in the market. It's a high-probability signal that the current trend is in jeopardy.
Breakouts: Continuing the Trend with Force
A breakout is the opposite of a reversal. Instead of price respecting a support or resistance level, it slices through it with conviction. A valid breakout confirms the strength of the existing trend and signals that it's likely to continue.
Candlestick Patterns in Support and Resistance; Candle at S/R
This article explains the difference between a breakout and a common trap that catches retail traders.
Read the following three sections: First, read about Breakout Candlestick Patterns. Note the description of a valid breakout candle: a large body with minimal shadows, closing decisively beyond the level. Next, read the section on trading the breakout strategy. This reinforces what a valid breakout looks like. Finally, and most importantly, read the section on Fake Breakouts. This is a critical concept for any serious trader.
The Ultimate Trap: The Fake Breakout
As you just read, a fake breakout (or "false break") is one of the most common and effective traps in the market. Price appears to break a key level, encouraging breakout traders to jump in. Then, it violently reverses, trapping those traders and often fueling a move in the opposite direction as their stop-losses are triggered.
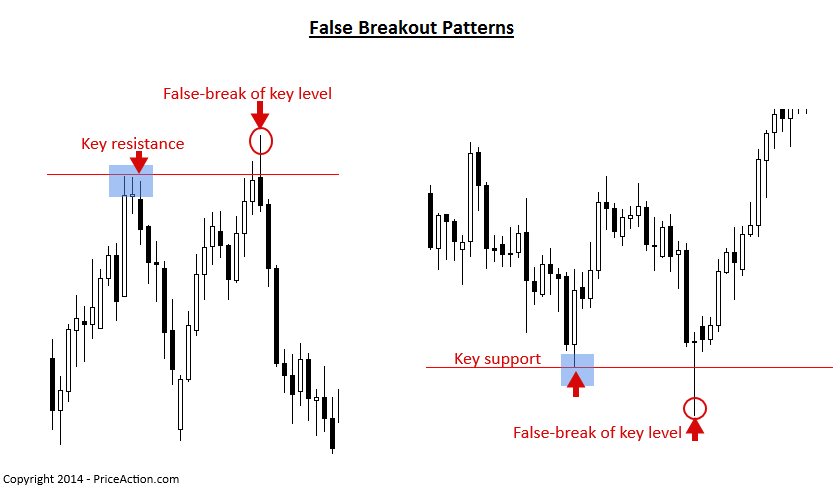
Recognizing the difference between a genuine breakout and a fake one is a hallmark of a professional operator. A genuine breakout shows strength and follow-through. A fake breakout is often a long, sharp wick that quickly retreats back into the previous range—a classic sign of a liquidity grab, just as the TradingFinder article described.
Conclusion
In this lesson, you've learned the fundamental grammar of price charts. You can now decode the story told by individual candlesticks and understand how they interact with the key market battlegrounds of support and resistance.
Key Takeaways:
- Candlesticks tell a story: The body shows conviction, and the wicks show the fight.
- Support and Resistance are memory: They are zones where the balance of power between buyers and sellers has previously shifted.
- Trends are the default state: An uptrend is a series of higher highs and higher lows; a downtrend is a series of lower highs and lower lows.
- Reversals and Breakouts are key events: These occur at S/R levels. Candlestick patterns like hammers, shooting stars, and engulfing patterns are high-probability signals of a potential reversal. A strong, full-bodied candle closing beyond the level signals a potential breakout.
- Beware the Fake Breakout: Price moving briefly past a level only to reverse sharply is a common trap designed to prey on amateur breakout traders.
You have now moved from understanding market mechanics to reading their direct output on a chart. In our next lesson, "Trend Analysis," we will build on this foundation. You'll learn how to assess the strength and momentum of a trend to better judge whether it's likely to continue or is on the verge of breaking down.