Introduction
In our last lesson, we dissected the mechanics of forced selling, exploring how leverage and margin calls can trigger liquidation cascades that crash prices far below their fundamental value. You learned that these events are not driven by sentiment or news, but by the cold, hard mechanics of risk management systems.
Today, we complete this picture by examining the mirror image of a liquidation cascade: the short squeeze. This lesson focuses on identifying how both forced buying and forced selling create dramatic price dislocations that are disconnected from a company's actual performance. Understanding these two powerful, opposing forces is a critical step in developing the "operator's instinct" you seek—the ability to distinguish between a price move driven by fundamentals and one driven by the structural fragility of market positioning.
Forced Selling: The Anatomy of a Collapse
Let's begin by solidifying our understanding of forced selling. The liquidation cascade we studied is a specific type of a broader phenomenon known as a liquidity spiral. An initial shock creates losses, which leads to a self-reinforcing cycle of selling.

This "forced selling" is not always caused by a simple margin call on a leveraged stock position. The pressure can come from more complex sources, creating dislocations that can be harder to spot. Let's look at two distinct examples.
The Anatomy of Market Chaos: A Comprehensive Analysis of Equity ...
This article analyzes market dislocations from a microstructure perspective. The case studies provide excellent, real-world examples of how forced selling can be triggered by factors beyond a simple stock trade going wrong.
Read the two case studies at the end of the article: First, read The Yen Carry Trade Unwind. Notice how the forced selling in US stocks had nothing to do with the fundamentals of those US companies. The selling was driven by a macro event (a change in Japanese interest rates) that blew up a leveraged trade elsewhere. Next, read The Meta Platforms Crash. Here, the trigger was fundamental (weak guidance), but the magnitude of the crash was a function of a liquidity vacuum. The sheer volume of sell orders overwhelmed the available bids, causing the price to gap down violently until it found new buyers at a much lower level.
These examples show that forced selling pressure doesn't just come from traders being over-leveraged in a single stock. It can come from macro shifts that unwind complex trades or from a simple lack of buyers when a widely-owned "blue chip" stock suddenly disappoints. The result is the same: a price move that reflects mechanical selling pressure more than a rational re-evaluation of the company's long-term worth.
Forced Buying: The Short Squeeze
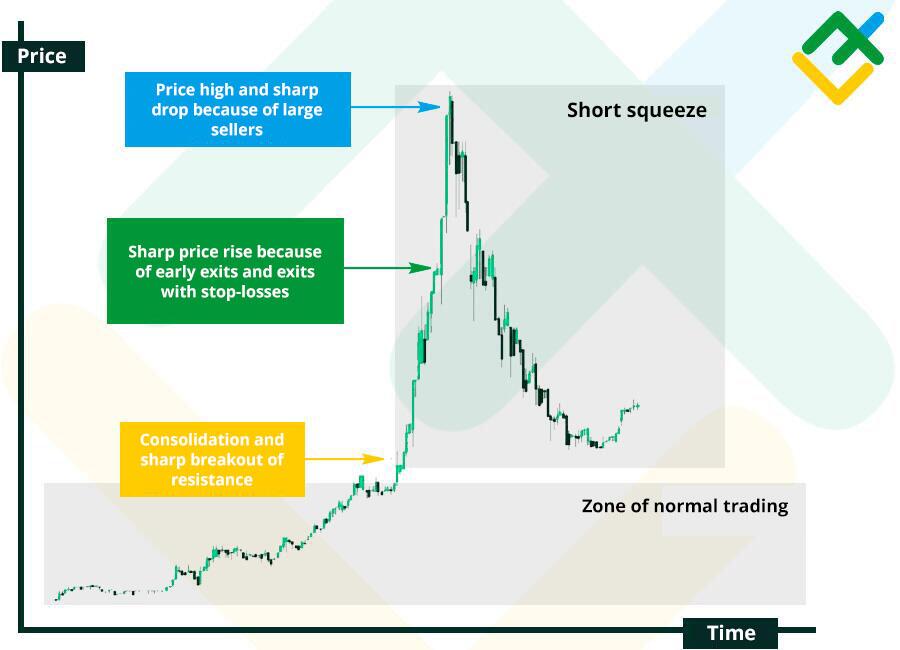
Now, let's turn to the other side of the coin: forced buying. This typically occurs in a short squeeze, one of the most explosive events in financial markets.
In the previous module, we touched upon the mechanics of short selling: a trader borrows shares, sells them, and hopes to buy them back later at a lower price. The risk is that the stock price rises instead of falls. Since there is no theoretical limit to how high a stock can go, the potential loss on a short position is infinite.
A short squeeze is the mechanism that realizes this risk on a massive scale.
How buying on margin affected the stock market - Bitget
This article clearly defines the key transmission channels for leverage in markets. It provides a concise, structured definition of both short and long squeezes.
Read the subsection Transmission mechanisms. Focus on the definitions provided for Forced selling and liquidity shocks and, most importantly, for Short squeezes and long squeezes. A "long squeeze" is just another name for the liquidation cascades we've already studied. Internalize the definition of a short squeeze: a rapid price rise forces short sellers to buy back shares, which pushes the price even higher.
This feedback loop—rising prices forcing short sellers to buy, which in turn pushes prices higher—can create parabolic price spikes that have no connection to the company's underlying business.
Case Study: The Mother of All Short Squeezes
The most famous short squeeze in history didn't involve a meme stock, but one of the world's largest car manufacturers: Volkswagen. In 2008, an audacious move by Porsche created a trap that cost hedge funds an estimated $30 billion.
The Most Violent Short Squeeze in History
This video from Hamish Hodder provides a brilliant and dramatic breakdown of the 2008 Volkswagen short squeeze. It perfectly explains how a mismatch between the number of shares shorted and the actual number of shares available for trading can lead to a market-breaking event.
Watch this video to understand the mechanics of a "classic" squeeze: The Setup: Understand why hedge funds were shorting VW and how Porsche began accumulating shares. The Trap: This is the critical part. Pay close attention to how Porsche used cash-settled options to secretly gain control of the majority of VW's shares, effectively removing them from the market without anyone knowing. The Squeeze: Witness the result. When Porsche revealed its ownership, short sellers who had borrowed and sold 12% of the company's shares suddenly discovered that only 6% were left to buy. The ensuing panic to cover their positions made Volkswagen, for a brief moment, the most valuable company in the world. The Aftermath: Grasp the scale of the losses, which were triple those seen in the famous GameStop squeeze.
The Volkswagen case is a pristine example of forced buying. The price surge from €200 to over €1000 had nothing to do with a sudden improvement in Volkswagen's car business. It was purely a result of a mechanical trap where the demand for shares to cover shorts vastly outstripped the available supply.
A Modern Twist: The Gamma Squeeze
The VW squeeze was a result of the physical supply of shares being cornered. In modern markets, a similar effect can be created through the derivatives market, specifically options. This is known as a Gamma Squeeze.
While we will cover options in depth in a later module, the concept is crucial for understanding modern price action. The mechanism is a positive feedback loop, but the entity being forced to buy is not the short seller—it's the market maker who sold the options.
The Anatomy of Market Chaos: A Comprehensive Analysis of Equity ...
This article explains the complex but powerful mechanism of a gamma squeeze, using the GameStop saga as a case study.
To understand this modern form of forced buying, read two key sections: First, read Gamma Exposure. Don't worry about the Greek letters for now. Focus on the core concept in Scenario B: Negative Gamma. When dealers sell lots of call options to speculators, they become "short gamma." To hedge their risk, they are forced to buy the stock when the price goes up, and sell it when the price goes down. This amplifies the market's move. Now, read the GameStop case study. This shows the negative gamma feedback loop in action. Retail traders bought massive amounts of call options. As the stock price started to rise, dealers who sold those options were forced to buy GME shares to hedge themselves. This buying pushed the price higher, which forced them to buy even more shares. This is the Gamma Squeeze: a spiral of forced buying by market makers.
Conclusion
You have now seen the two great forces of mechanical price dislocation. On one side, the liquidation cascade (or "long squeeze"), where falling prices and margin calls create a spiral of forced selling. On the other, the short squeeze and gamma squeeze, where rising prices and trapped positioning create a spiral of forced buying.
Key Takeaways:
- Price Dislocation: Both forced selling and forced buying create price movements that are disconnected from a company's fundamental value. The price is driven by positioning and plumbing, not by P/E ratios or cash flow.
- Involuntary Trading: The common thread is that participants are not trading by choice. They are being forced to buy or sell by risk limits, margin requirements, or hedging mechanics.
- The Operator's Edge: Recognizing the conditions for these events—high leverage, high short interest, concentrated options activity—is a key source of edge. It allows you to anticipate moments of extreme volatility and understand when a price chart is lying about a company's health.
We have now explored the deepest, most chaotic layers of market structure. In the next module, Technical Analysis, Price Action, and Market Psychology in Charts, we will zoom out and learn how to read the footprints these massive events leave on the price chart. You will learn the grammar of price movement—support, resistance, trends, and volume—that will allow you to turn your understanding of these structural forces into a practical framework for analyzing markets.