Introduction
In our last lesson, we constructed a complete, rules-based playbook for a trend-following strategy. You learned how to define an unambiguous trend and use filters to enter on strength, with the goal of riding a move for as long as it lasts. This is a powerful tool for markets with clear direction. But what about the vast periods when the market is not trending, but chopping back and forth? For those conditions, we need a different weapon.
Today, we shift our focus to the opposite strategy: mean reversion. This lesson will teach you to define and document a playbook for trading in range-bound or corrective environments. Instead of buying strength, you'll learn the logic of buying weakness—fading moves that have become statistically overstretched, betting on the "snapback" to a historical average. Your objective is to build a second, equally explicit algorithm for market engagement, one that profits from the market's tendency to oscillate rather than trend. This adds a crucial and complementary tool to your operator's toolkit.
The Logic of Mean Reversion: The Rubber Band Effect
At its core, mean reversion is based on a simple statistical observation: asset prices, while they can trend, tend to spend most of their time oscillating around an average, or "mean." When a price stretches too far from this mean, it's like pulling a rubber band. The further it stretches, the more tension builds for it to snap back. A mean reversion trader isn't trying to predict a new trend; they are making a probabilistic bet on this snapback.
Mean Reversion System That Works (Backed By Data)
To grasp this core concept, watch this introductory segment from Rayner Teo's video, "Mean Reversion System That Works." He provides an excellent analogy that makes the logic intuitive.
Watch from the beginning of his explanation at this timestamp. Focus on the rubber band analogy and the visual of buying a pullback (the "falling knife") to profit from the subsequent bounce.
This is a counter-intuitive approach. As a mean reversion trader, you are actively seeking out charts that look "ugly" in the short term, buying into fear with the expectation that the selling is exhausted. This requires discipline and a departure from the "buy high, sell higher" logic of trend following. The payoff is that these systems can have very high win rates, as markets often revert to their mean.
Identifying the Setup: Your Instrument Panel
To trade mean reversion, you need instruments that can quantify when a price is "stretched." Eyeballing it is not a system. We rely on statistical indicators that measure deviation and momentum.
1. Bollinger Bands
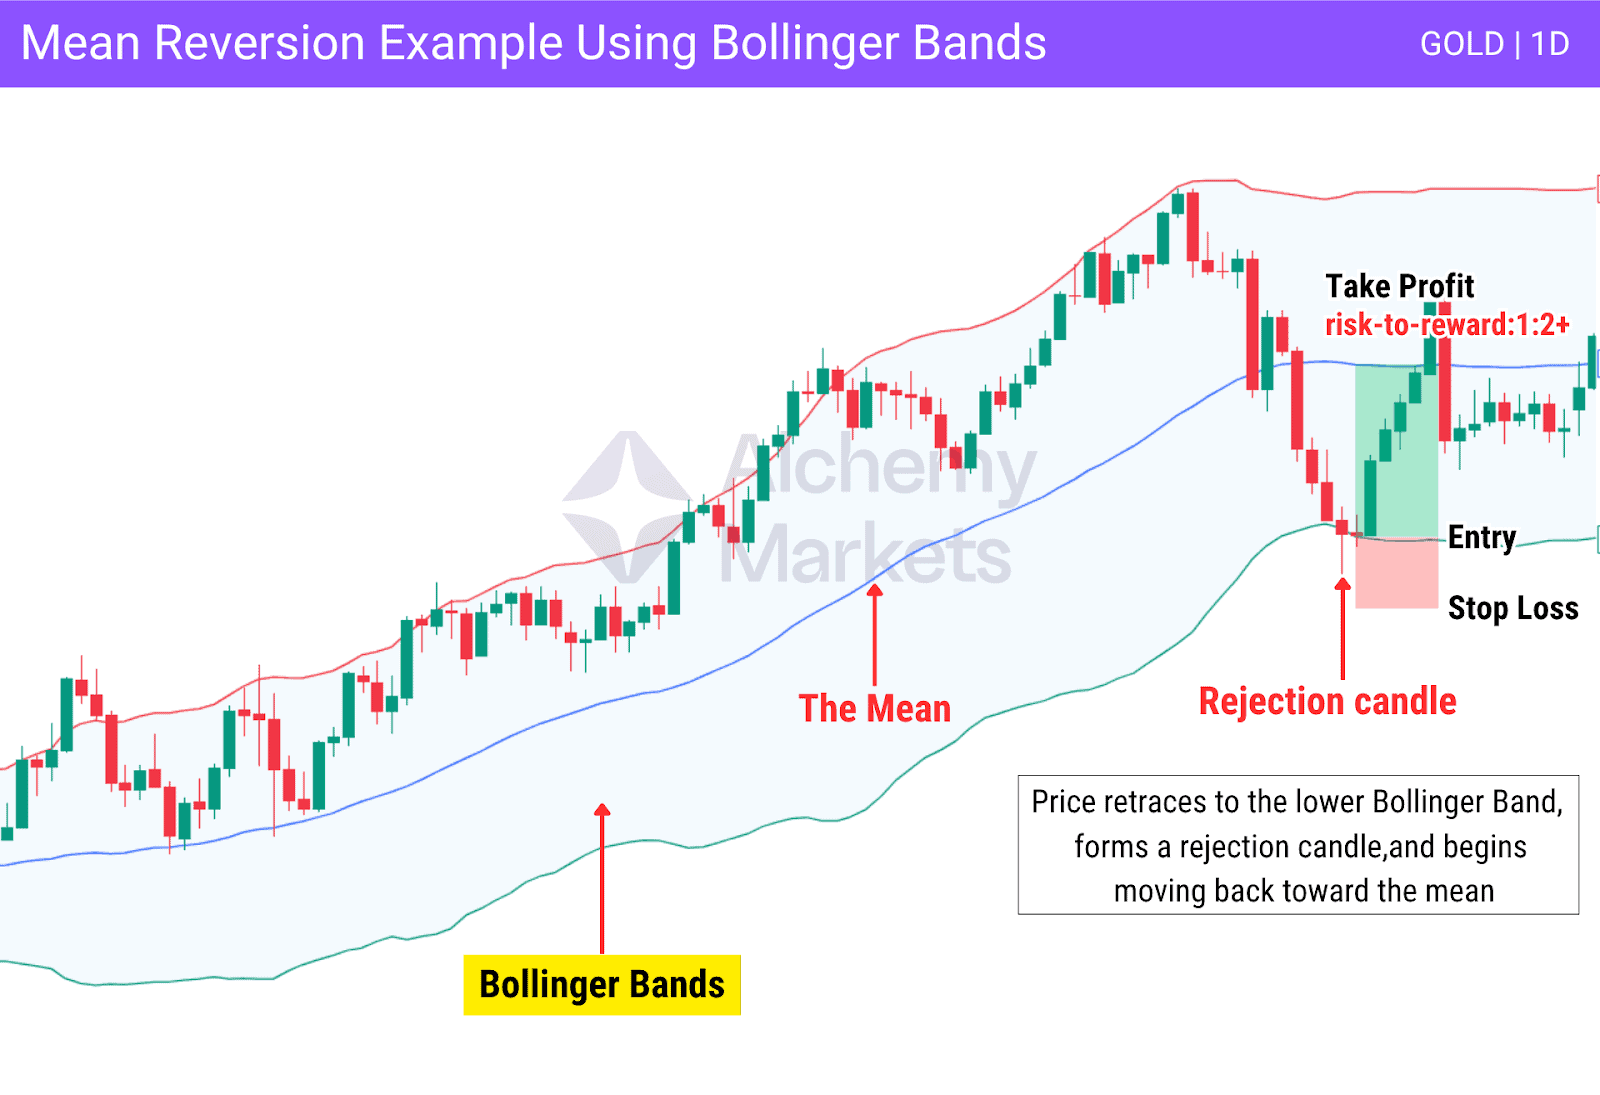
Bollinger Bands are one of the most direct tools for this. They plot a moving average (the mean) and then create an envelope two standard deviations above and below it. A price moving outside these bands is, by definition, a statistically significant event. In a range-bound market, a touch of the lower band is a potential buy signal, and a touch of the upper band is a potential sell signal. The middle band serves as a natural profit target—the "mean" to which the price is expected to revert.
2. Momentum Oscillators (RSI & Stochastic)
Oscillators like the Relative Strength Index (RSI) or the Stochastic Oscillator measure the speed and change of price movements. They operate on a bounded scale (e.g., 0 to 100 for RSI).
- Readings below 30 on the RSI are typically considered oversold.
- Readings above 70 are considered overbought.
These indicators act as a confirmation layer. When the price hits the lower Bollinger Band and the RSI is deeply oversold, the probability of a snapback increases significantly.
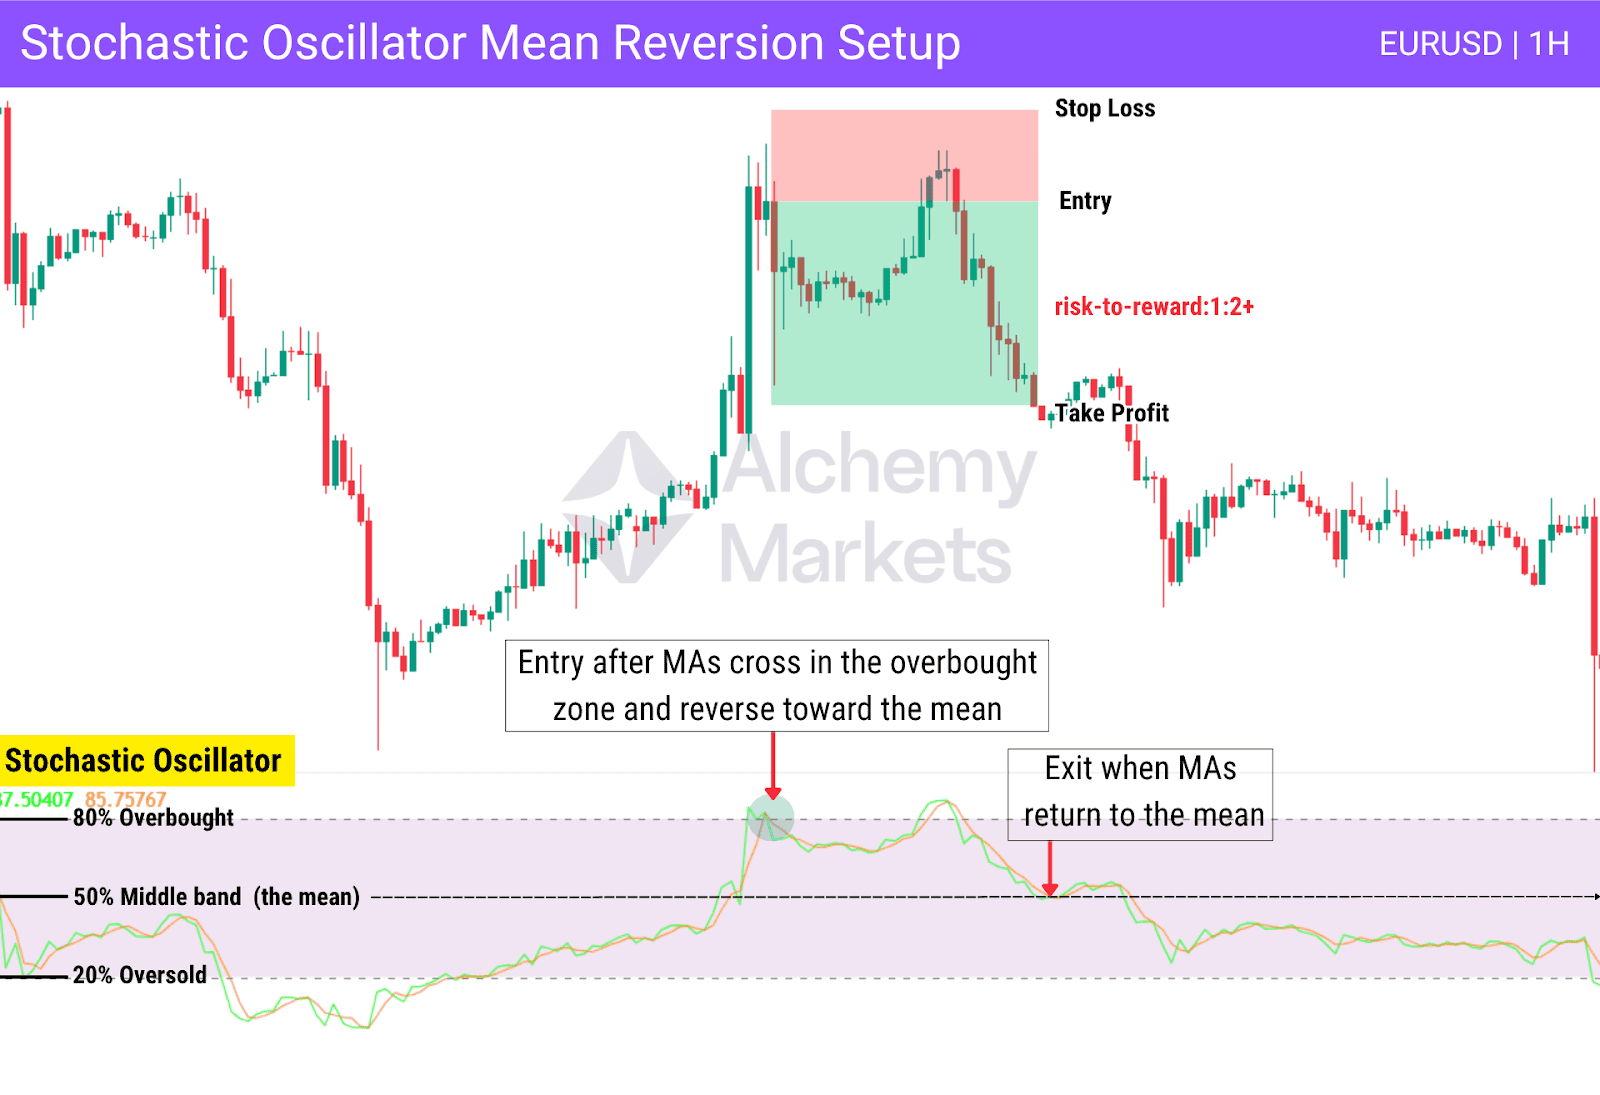
These tools are most powerful when used in combination to find a point of "confluence," where multiple signals align to flag a high-probability setup.
Mean Reversion Playbook - Fade, Scale, Exit
The LuxAlgo blog provides a fantastic, systematic breakdown of how to combine indicators and define entry rules. This reading will give you a clear, structured approach.
First, read the section "Finding Mean Reversion Trade Setups," paying close attention to the table that shows how Bollinger Bands and RSI work together. Then, move to the next section, "Fade Entry Rules." Study the three pillars of a fade entry and the table outlining the required signals. This provides the blueprint for building our playbook's entry rules.
Building the Mean Reversion Playbook
Now, let's assemble these concepts into a concrete, documented playbook. We will build a system heavily inspired by the quantitative approach detailed in the resources. This system is designed to be mechanical, removing emotion and discretion from the process.
Rule 0: The Regime Filter
The single biggest mistake in mean reversion is trying to buy dips in a crashing bear market. A falling knife in a bull market is a pullback; a falling knife in a bear market is just... a falling knife. Therefore, we need a regime filter.
Arthur Hill: Profiting From a Mean Reversion System (04.25.18)
In his presentation, "Profiting From a Mean Reversion System," analyst Arthur Hill demonstrates the critical importance of a market timing filter. The difference in results is dramatic.
Watch the segment starting at this timestamp. He compares a mean reversion system traded with and without a broad market filter. Notice how the drawdown plummets and the return improves significantly when the filter is applied. This is a crucial professional insight.
Regime Rule: Only initiate long mean-reversion trades if the broad market index (e.g., Nifty 50, S&P 500) is trading above its 200-day simple moving average (SMA).
Rule 1: Entry Rules ("The Fade")
We need a precise, multi-condition trigger to identify a high-probability pullback.
- Condition 1 (Stock's Own Trend): The individual stock must be in a long-term uptrend.
- Rule: The stock's price must be above its 200-day SMA.
- Condition 2 (The Oversold Signal): The stock must show a significant short-term deviation to the downside.
- Rule: The price must close below the lower Bollinger Band. Use settings of a 20-period moving average with a 2.5 standard deviation. Using 2.5 instead of the standard 2.0 demands a more extreme deviation, filtering for higher-quality signals.
- Condition 3 (The Entry Trigger): We don't buy on the close. We anticipate one more push down.
- Rule: After a close below the lower Bollinger Band, place a buy limit order 3% below that day's closing price. This is an algorithmic way to try and catch a moment of final capitulation.
Rule 2: Stop-Loss Rules (Invalidation)
Mean reversion strategies have a unique approach to risk management. Because you are buying into weakness, the trade will often go against you initially. A tight stop-loss would get you knocked out constantly.
Mean Reversion Trading Techniques: A Complete Guide 2024
This guide provides an excellent framework for setting stop-losses in mean reversion trades based on market volatility.
Read the section on "Risk Management in Mean Reversion Trading." Focus specifically on the subsection "Stop Loss Placement" and the table provided. This gives you a clear, ATR-based method for defining your risk.
- Primary Stop (Time-Based): The biggest risk is a stock that never bounces. A profitable mean reversion trade should work relatively quickly. If it doesn't, it's likely a failed setup.
- Rule: If the trade has not hit its profit target after 10 trading days, exit the position. This is a time stop that prevents you from holding a losing trade indefinitely.
- Catastrophic Stop (Volatility-Based): We also need a hard floor to protect against a true trend change or a black swan event.
- Rule: Place a hard stop-loss at 2 times the 20-day Average True Range (ATR) below your entry price. This gives the trade room to breathe but defines a maximum acceptable loss based on the stock's recent volatility.
Rule 3: Exit Rules (Capturing the Snapback)
The goal is to exit as the price reverts toward its mean. We are not trying to catch a new trend. We want to capture the quick, high-probability bounce.
Mean Reversion System That Works (Backed By Data)
Rayner Teo's system uses a very specific, momentum-based exit designed to capture the first burst of strength off the lows.
First, re-examine the trading rules at this timestamp, where he states the exit rule: "sell when the 2-day RSI crosses above 50". Then watch the chart example from this segment to see exactly how this works in practice.
- Primary Exit (Momentum-Based):
- Rule: Exit the trade at the market open on the day after the 2-period RSI closes above 50. This hyper-sensitive RSI is designed to detect the very first sign that upward momentum has returned, allowing you to lock in the quick profit from the bounce.
Your Documented Playbook: The Snapback Strategy
Here is the complete system documented as a clear, repeatable playbook.
- Playbook Name: The Snapback
- Trade Universe: Large-cap stocks (e.g., Nifty 500, Russell 1000)
- Timeframe: Daily Chart
- Regime Filter:
- Do not initiate new long trades unless the Nifty 50 / S&P 500 index is above its 200-day SMA.
- Do not initiate new long trades unless the Nifty 50 / S&P 500 index is above its 200-day SMA.
- Entry Rules:
- The stock's price must be above its 200-day SMA.
- The stock's price must close below the lower Bollinger Band (20, 2.5).
- On the day following the signal, place a buy limit order 3% below the prior day's close.
- If multiple stocks qualify, rank them by 150-day price performance and select the strongest.
- Stop-Loss Rules:
- Time Stop: Exit the position if a profit target is not hit within 10 trading days of entry.
- Hard Stop: Place an initial stop-loss at 2x ATR(20) below the entry price.
- Exit Rule (Profit Taking):
- Exit at the market open on the day after the 2-period RSI closes above 50.
Conclusion
You have now engineered a second complete trading system. Where the trend-following playbook was designed to capture sustained momentum, this mean-reversion playbook is designed to systematically fade temporary emotional extremes. You are building a versatile operational toolkit, not just learning a single trick.
Key Takeaways:
- Mean Reversion is a Probabilistic Bet: It profits from the high probability that an overstretched price will revert to its average.
- It Requires Different Tools: Indicators like Bollinger Bands and RSI are essential for quantifying "overstretched" conditions.
- Risk Management is Counter-Intuitive: It often involves wider price stops or time-based stops to allow for initial weakness before the expected bounce.
- Exits are Quick and Disciplined: The goal is to capture the snapback to the mean, not to ride a new trend.
- Context is Everything: Mean reversion works best in range-bound markets and should be filtered by the broader market's long-term trend.
With this lesson, Module 6 on technical analysis is complete. You have moved from reading charts to building explicit systems for engaging with them. In the next module, "Fundamental Analysis and Company Quality," we will pivot dramatically. We'll move from analyzing price to analyzing the businesses behind the price, learning to answer the question: Is this a good company? This will ultimately allow you to fuse technical setups with fundamental conviction, the hallmark of a truly well-rounded analyst.