Introduction
In the last module, you mastered the art of reading price action, building systematic playbooks for both trend-following and mean-reversion strategies. You learned to operate on the level of charts, volume, and momentum—the what and how of price movement. Now, we pivot. Welcome to Module 7, where we move from reading the tape to reading the business itself. Our goal is to understand the why behind the price—the fundamental engine that creates value.
This lesson introduces the most foundational concept in fundamental analysis: the business model. A company's stock is not just a ticker; it's a claim on the future cash flows generated by its underlying business. The structure of that business—its "archetype"—determines its potential for growth, profitability, and durability. Your objective today is to learn how to distinguish between these key archetypes, from traditional manufacturing to modern platforms, and to identify the specific value drivers and metrics that define the game each one is playing.
The Analyst's Framework: Business Model as the Engine
Before we dissect individual companies, we need a framework. A business model is the architecture of value creation. It dictates how a company produces something, delivers it to customers, and gets paid. An analyst's first job is to identify this architecture, because every model has a different set of rules, risks, and key performance indicators (KPIs).

We will explore four primary business model archetypes. While many companies are hybrids, understanding these pure forms will give you the mental models to deconstruct almost any business you encounter.
Unit Economics and the Financial Model of the Business
To begin, let's get a formal introduction to these archetypes from Karl T. Ulrich, a professor at the Wharton School. His article provides a clear, structured overview.
Read the introductory section, starting from the list of four archetypes. This will set the stage by defining the categories we'll be exploring: make-and-sell, low-marginal-cost services, social networks, and marketplaces.
Now, let's break down each of these engines.
Archetype 1: The "Make-and-Sell" Machine
This is the classic, tangible business model. You manufacture a physical product or deliver a distinct service, and you sell it in a single transaction. Think of an automaker like Tata Motors, a consumer goods company like Hindustan Unilever, or a restaurant.
The entire game for this model revolves around one central metric: Gross Margin.
Gross Margin = (Revenue - Cost of Goods Sold) / Revenue
The Cost of Goods Sold (COGS) represents the direct, or marginal, costs of producing one more unit—the raw materials, factory labor, and shipping. The higher the gross margin, the more money is left over to cover fixed costs (like R&D, marketing, and administration) and, eventually, generate profit.
Unit Economics and the Financial Model of the Business
The Ulrich article provides an excellent, detailed breakdown of the make-and-sell model using a real-world example of a kitchen goods company. This will concrete the concepts of COGS and target costing.
Read section 1, titled "Classic Make-and-Sell" Businesses. Pay close attention to how the Cost of Goods Sold (COGS) is calculated for the bottle opener. Also, study the "Target Costing" analysis, which shows how companies work backward from a retail price to determine if a product is economically viable. This is a core discipline in manufacturing.
Operator's Edge: When you look at a make-and-sell business, your first question is about its margins. Are they stable, expanding, or compressing? What gives them pricing power? For these businesses, operational efficiency, supply chain management, and brand strength are paramount. Their path to wealth is a slow, steady grind of optimizing costs and defending price points.
Archetype 2: The SaaS Recurring Revenue Engine
Software-as-a-Service (SaaS) flips the classic model on its head. Instead of selling a product, you sell a subscription for ongoing access to a service. Think of Adobe Creative Cloud, Microsoft 365, or a B2B software company like Zoho.
This model is not about single transactions; it's about relationships. The core value drivers are completely different.
- Customer Lifetime Value (LTV): The total gross profit a company expects to make from a single customer over the entire duration of their relationship.
- Customer Acquisition Cost (CAC): The total cost of sales and marketing required to acquire one new customer.
The fundamental health of a SaaS business is determined by the LTV to CAC ratio. A healthy business must have an LTV that is significantly greater than its CAC. A common benchmark is an LTV:CAC ratio of 3x or higher.
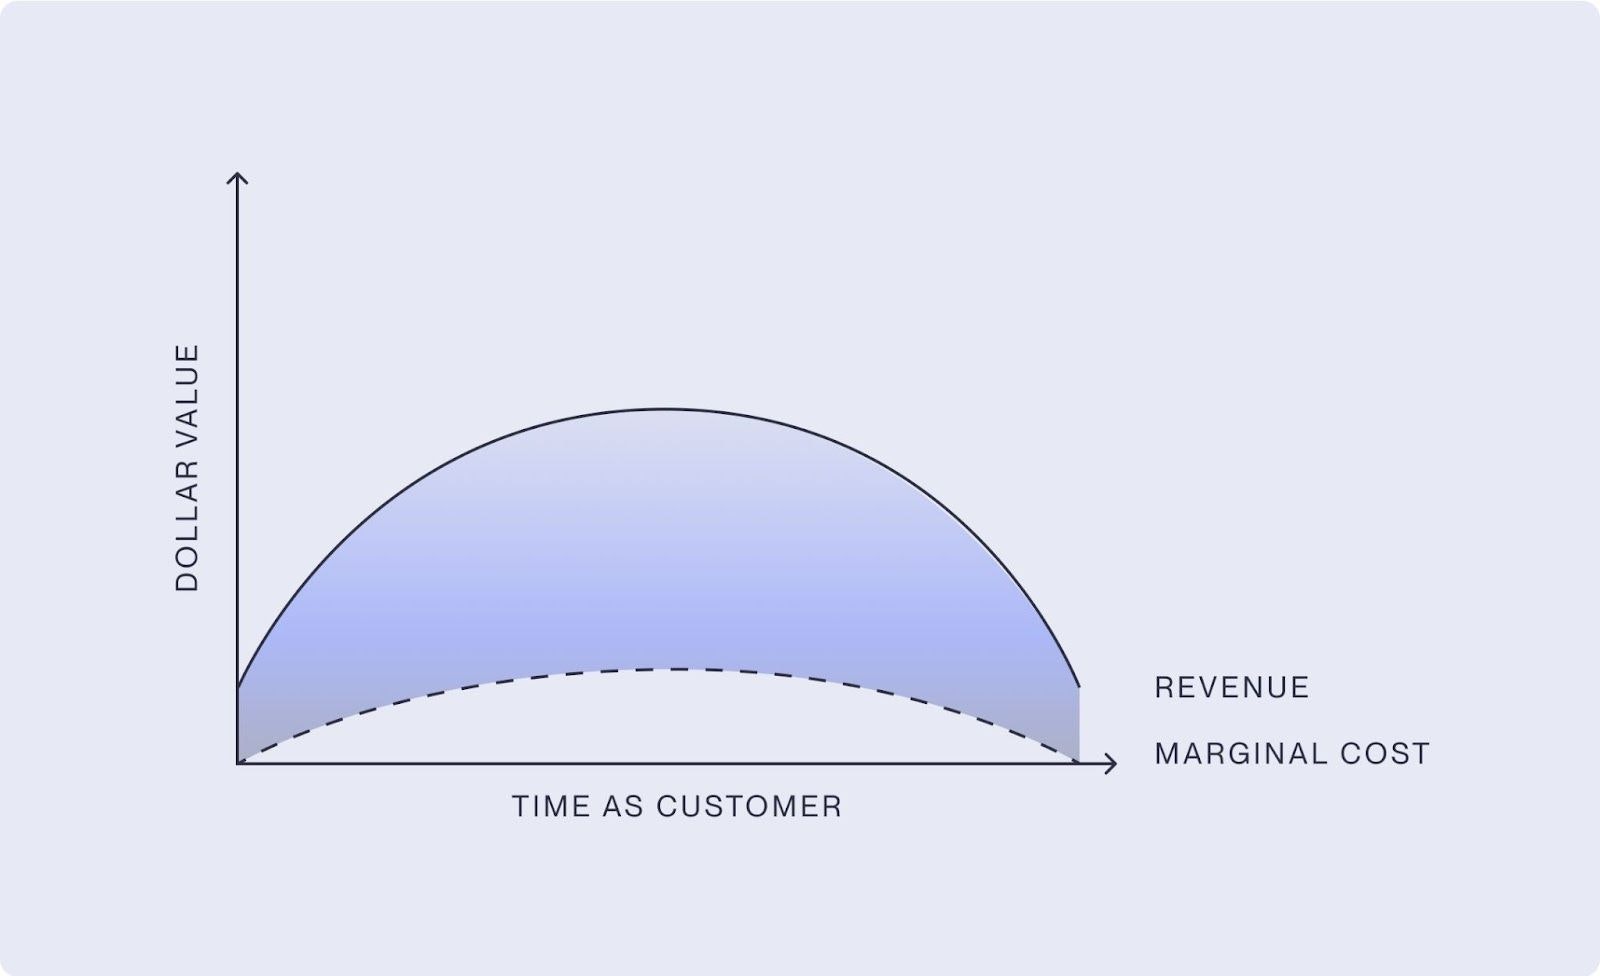
A crucial variable in this model is churn, the rate at which customers cancel their subscriptions. A high churn rate destroys LTV and can cripple a SaaS business. The ultimate prize is negative churn, which occurs when the expansion revenue from existing customers (upgrades, cross-sells) is greater than the revenue lost from customers who cancel. This is the holy grail, as it means the business can grow even without adding new customers.
The SaaS business model & metrics: Understand the key drivers for success
David Skok, a prominent venture capitalist, provides a masterclass on the SaaS model from an investor's perspective. His insights are critical for understanding why these businesses are valued the way they are.
Watch these key segments from his talk: First, understand the goal of a SaaS business. Watch the segment on building a repeatable, scalable, and profitable growth machine. Next, grasp the core unit economics. Watch his explanation of CAC, LTV, and the "SaaS cash flow trough." This "trough" is a key concept that explains why rapidly growing SaaS companies often report large losses—a market reality that confuses many investors. Finally, understand the power of retention. Watch his explanation of negative churn and why it's a critical driver of long-term success.
Operator's Edge: For SaaS, you're not looking at inventory or supply chains. You're looking at user metrics. What is the churn rate? Is it improving? What is the LTV:CAC ratio? Are they achieving negative churn? A SaaS business with low churn and high negative churn is a compounding machine, which is why the market rewards them with such high valuations.
Archetype 3: The Platform (Marketplaces & Networks)
Platforms don't create their own products. They create a space—physical or digital—where different groups of users can connect and transact. This category includes:
- Marketplaces: Connect buyers and sellers (e.g., Airbnb, Zomato, eBay).
- Social Networks: Connect users to each other and to content (e.g., Facebook, LinkedIn, X).
The dominant force behind any successful platform is the network effect.
What Are Network Effects? (Startup Mini-Series)
The venture firm NFX specializes in network effects. This short video offers a precise definition and distinguishes it from a related but different concept: virality.
First, watch the definition of what network effects are. The key idea is that each new user adds value to the existing users. Then, watch the critical distinction between network effects and viral effects. Virality is about acquisition (getting new users), while network effects are about defensibility (keeping them by making the product better).
For marketplaces, the key metrics are:
- Gross Merchandise Value (GMV): The total value of all goods and services transacted on the platform in a given period. This measures the scale of the economy the platform has created.
- Take Rate: The percentage of GMV that the platform keeps as its own revenue.
Revenue = GMV x Take Rate
Unit Economics and the Financial Model of the Business
Let's return to the Ulrich article for a clear definition of these marketplace metrics, using Airbnb as the case study.
Read section 4, titled "Marketplaces." Focus on the definitions of GMV and Take Rate. Notice how Airbnb's take rate is a reflection of its market power, which is derived from its powerful network effects.
For social networks, the model is often based on monetizing user attention through advertising. The "product" is the user's engagement, sold to advertisers. The value drivers are user growth, engagement metrics (e.g., daily active users), and the ability to command high advertising rates.
Operator's Edge: With platforms, you must think in terms of network strength. Is the network growing? Is engagement increasing? For marketplaces, is GMV growing, and is the take rate stable or increasing? A weakening network effect is a five-alarm fire for a platform business.
Reality Check: The Food Delivery Wars
Theory is useful, but the real world is messy. Let's see how these archetypes battle it out in a notoriously difficult industry: food delivery.
This article from Mag Startup is a brilliant case study of competing business models. It's a perfect example of applying our frameworks to a real, high-stakes market conflict.
First, read the section "Anatomy of the aggregator model." This shows the brutal unit economics of the marketplace model (like Zomato or Swiggy) where high GMV is eroded by high variable costs, leading to tiny margins. Next, read "The silent alternative: the OS platform model." This describes the SaaS approach (like ChowNow), which offers restaurants a tool for a fixed fee, leading to much higher capital efficiency. Then, read about the creative hybrid model emerging in Algeria, starting from this section. This shows how a deep understanding of local market conditions can lead to an entirely new model that monetizes drivers and advertisers, not restaurants. Finally, read the summary section "Comparative profitability: three models, three trajectories." This puts the capital efficiency and path to profitability of all three models side-by-side.
This case study is a powerful illustration of why business model analysis is not an academic exercise. The choice between an aggregator (marketplace) and an OS (SaaS) model has billion-dollar consequences for capital requirements, profitability, and long-term viability. The Algerian example shows that the most powerful models are often those that are uniquely adapted to a specific market's inefficiencies.
Conclusion
Today we've moved from the world of price charts to the world of business architecture. You've learned to identify the core engines of value creation and the specific metrics that tell you if those engines are running efficiently.
Key Takeaways:
- Business models are archetypes: Understanding the "make-and-sell," "SaaS," and "platform" models gives you a powerful toolkit for deconstructing any company.
- Each model has unique value drivers:
- Make-and-Sell: The game is about Gross Margin.
- SaaS: The game is about the LTV:CAC ratio and minimizing Churn.
- Platforms: The game is about Network Effects, measured by GMV and Take Rate.
- The model dictates the economics: As the food delivery wars show, the chosen business model fundamentally determines a company's path to profitability and its capital needs. An analyst who understands this can see signals that others miss.
In our next lesson, we will build directly on this foundation. We'll explore Competitive Advantage and Moat Analysis. If the business model is the engine that generates cash, the moat is the fortress that protects that engine from competitors. You will learn to assess how durable a company's success truly is.