Introduction
In our last lesson, we explored Implied Volatility (IV) as the market's pulse—a forward-looking measure of expected price movement derived directly from option prices. You learned to read it as a "fear gauge" and identified the predictable pattern of the "volatility crush," where IV collapses after a known event like earnings, often destroying an option's value.
This raises a critical operational question: how do we precisely measure an option's sensitivity to these dramatic swings in IV? Being right on a stock's direction is not enough if a collapse in volatility wipes out your gains. Today, we introduce Vega, the Option Greek that quantifies this risk. This lesson will equip you to understand how changes in IV, as measured by Vega, can make or break an options position, often completely independent of the stock's price movement. This is a crucial step in moving from simply trading direction to trading volatility itself.
What is Vega?
In simple terms, Vega is the amount an option's price is expected to change for every one-percentage-point change in implied volatility.
Think of it as a direct sensitivity metric. If an option has a Vega of 0.10, it means:
- If IV increases by 1% (e.g., from 30% to 31%), the option's price will increase by $0.10.
- If IV decreases by 1% (e.g., from 30% to 29%), the option's price will decrease by $0.10.
Vega is always expressed as a positive number for both calls and puts. This makes sense because higher volatility increases the chance of an option finishing in the money, making both calls and puts more valuable, all else being equal.
From a quantitative perspective, Vega is the first-order partial derivative of the option's value with respect to volatility (). It isolates the impact of volatility changes from all other factors.
[PDF] MENTAL MODELS FOR VOLATILITY - BetterExplained
This document from BetterExplained, which we glanced at previously, situates Vega within the Black-Scholes model and highlights its power.
First, look at the table under the heading Black-Scholes Model. You'll see Vega listed as the sensitivity of the option's value to Volatility. Next, jump to the appendix section titled Model Assumptions. Pay close attention to the statement: "If IV rises enough, both puts and calls can increase in value!" This is the core concept that Vega explains.
The Behavior of Vega
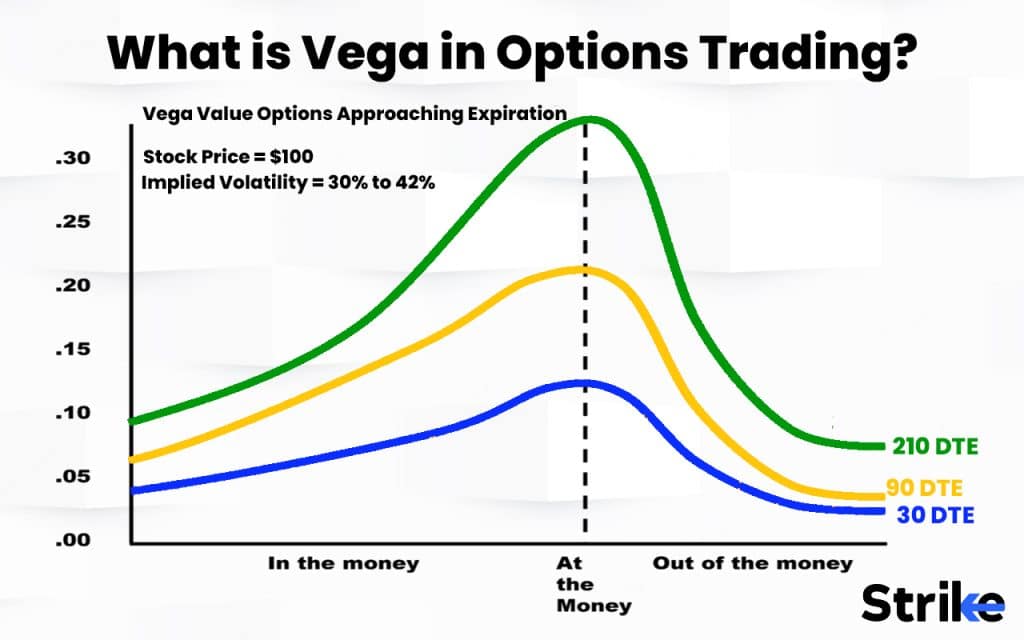
The magnitude of Vega is not constant; it changes based on two key factors: an option's moneyness and its time to expiration. Understanding this behavior is key to anticipating how vulnerable (or sensitive) a specific option is to shifts in IV.
-
Time to Expiration (DTE): Longer-dated options have higher Vega. The logic is straightforward: an option with more time until it expires has more "potential" for the underlying stock to make a large move. Therefore, a change in the market's expectation of future moves (IV) has a much larger impact on the price of a long-term option than a short-term one.
-
Moneyness: Vega is highest for at-the-money (ATM) options. ATM options have the greatest amount of uncertainty and the highest extrinsic value (time and volatility value). As an option moves deep in-the-money (ITM) or far out-of-the-money (OTM), its price becomes dominated by intrinsic value (for ITM) or approaches zero (for OTM). In both cases, the extrinsic value shrinks, and with it, the sensitivity to changes in volatility.
This relationship is perfectly captured in the following chart.
Vega in Action: Quantifying the "IV Crush"
The most dramatic and common demonstration of Vega's power is the post-earnings IV crush. Let's walk through a concrete example to see how being right on direction can still lead to a massive loss.

Let's put numbers to this phenomenon.
What is Volatility Crush? Why Options Lose Value After Earnings
This article from Share Predictions provides an excellent, practical walkthrough of how an IV crush financially impacts an option buyer.
Read the section titled The Mechanics: How the Math Works. It breaks down a pre-earnings trade scenario into the gain from the stock move (Delta) and the loss from the IV drop (Vega), showing exactly how the net result can be negative.
Let's formalize the calculation from the article:
Scenario: Buying a Call Before Earnings
-
Before Earnings:
- Stock Price: $100
- Implied Volatility (IV): 100% (highly elevated)
- Option: ATM Call, Price = $5.00
- Vega: $0.10 (The option price will change by $0.10 for each 1% change in IV)
- Delta: 0.50 (For a $1 stock move, the option price changes by $0.50)
-
After Earnings:
- The news is good! The stock jumps 3% to $103.
- The uncertainty is gone. IV collapses from 100% to 50%.
The Damage Report:
- Gain from Direction (Delta): The stock moved up by $3. The gain from this is approximately .
- Loss from Volatility (Vega): IV dropped by 50 percentage points (100% - 50%). The loss from this is .
New Option Price ≈ Initial Price + Delta Gain - Vega Loss
Despite being correct about the stock's direction, the position lost 70% of its value. The loss from the Vega exposure completely overwhelmed the gain from the Delta exposure. This is how Vega can break a position.
Long Vega vs. Short Vega: Strategic Implications
Understanding Vega immediately splits the options world into two camps: those who are long volatility and those who are short volatility.
- Long Vega Positions: These are net buyers of options (e.g., long calls, long puts, long straddles). A trader with a long Vega position benefits from an increase in implied volatility and is harmed by a decrease. If you buy an option, you want IV to go up.
- Short Vega Positions: These are net sellers of options (e.g., short calls, short puts, short straddles, iron condors). A trader with a short Vega position benefits from a decrease in implied volatility (like an IV crush) and is harmed by an increase. If you sell an option, you want IV to go down.
Mastering Implied Volatility: What Options Traders Need to Know
This video from projectoption provides excellent visualizations and a real-world case study on how IV changes affect different option strategies.
First, watch from why implied volatility is so important. This segment shows P&L graphs for long calls, long puts, short strangles, and short straddles, clearly demonstrating how each strategy performs when IV increases versus decreases. This will solidify your understanding of long vs. short Vega. Then, jump to the bonus section on GameStop (GME) from a bonus section. This is a perfect real-world example of a trader buying puts (a long Vega, bearish position) who was correct on direction (the stock fell) but still lost money because the collapse in IV was so massive. It's a powerful illustration of Vega overwhelming Delta.
The key insight for an operator is that when you place an options trade, you are making a bet not just on direction (Delta) and time (Theta), but also on volatility (Vega). Knowing whether you are long or short Vega is as fundamental as knowing whether you are bullish or bearish.
Vega and Delta: An Interplay
It's crucial to remember that Vega doesn't operate in a vacuum. The final P&L of your position is a result of the interplay between all the Greeks. A large, favorable move in the stock price (Delta) can sometimes be enough to overcome a negative Vega impact from an IV crush. Conversely, as we saw with the GME example, a huge IV crush can negate a correct directional bet.
How to Trade Options: Implied Volatility Crush
This video from Roman Paolucci offers a sophisticated, practical view on trading IV crush, showing how the different exposures interact.
Watch from a great example of this. The presenter demonstrates that while an IV decline hurts an option's value, a massive price movement can more than compensate for it. Next, watch his trade recap on Nvidia and Dell from my live Interactive Brokers account. This is a brilliant real-world demonstration. In his Nvidia trade, he was short volatility and got the direction right, resulting in a win. In his Dell trade, he was also short volatility and the IV crush occurred as expected, but the directional move against him was so large that it overwhelmed his Vega gains, leading to a loss. This is the professional way to analyze P&L.
Conclusion
You have now moved beyond simply knowing that volatility matters to quantifying how much it matters for a specific option. Vega is the bridge between the abstract concept of implied volatility and the concrete P&L in your account.
Key Takeaways:
- Vega measures an option's price sensitivity to a 1% change in implied volatility.
- Vega is highest for at-the-money (ATM), long-dated options. These are the most sensitive to IV changes.
- An IV crush is a loss in option value driven by a collapse in IV, and its magnitude is determined by the option's Vega. This is how Vega can break a position.
- Conversely, an unexpected spike in IV can rapidly increase an option's price, even with little stock movement. This is how Vega can make a position.
- Long Vega positions (option buyers) profit from rising IV. Short Vega positions (option sellers) profit from falling IV.
In our previous lessons, we've broken down an option's risk into its core components: directional risk (Delta/Gamma), time decay risk (Theta), and now volatility risk (Vega). In our next lesson, we will begin to synthesize this knowledge to explore Hedging With Derivatives, where you'll learn how professionals use these instruments not just for speculation, but to precisely manage and neutralize these risks in their portfolios.