Introduction
In our previous lessons, we've systematically dismantled the components of an option's price. We started with the Option Greeks—Delta, Gamma, and Theta—which describe how an option's value changes in response to price movement and the passage of time. You learned that Theta decay is a relentless force, a "steamroller" that constantly erodes an option's extrinsic value.
Today, we shift our focus to the single most important driver of that extrinsic value: Implied Volatility (IV). This lesson is about decoding the market's collective expectation—its fear, greed, and uncertainty—all of which are quantified in this single number. Your goal is to move beyond a simple definition and understand how to read IV as a live signal of market sentiment, a skill that separates operators from amateurs.
What is Implied Volatility?
Before we dive into implied volatility, let's be clear on what volatility itself means in a market context. In simple terms, it's a measure of how much and how quickly a stock's price moves. A stock that trades in a tight, predictable range has low volatility, while one with wild, unpredictable swings has high volatility.
There are two primary ways to measure this:
- Historical Volatility (HV): This is backward-looking. It calculates the actual price movement that has already occurred over a past period. It tells you how volatile the stock was.
- Implied Volatility (IV): This is forward-looking. It represents the market's consensus forecast of how volatile a stock is expected to be in the future.
For a trader, historical volatility is useful for context, but implied volatility is where the game is played. It dictates the price of options right now.
Let's get a clear definition and see how it works in practice.
Implied Volatility Explained: How to Use IV% to Trade Options Smarter
This video from Pandrea Money offers a straightforward, practical introduction to implied volatility, distinguishing it from historical volatility and defining it as a forward-looking measure.
Watch the following segments to build a solid foundation: What is Volatility?: This covers the basic concept of price movement and uncertainty. Two Main Types: Focus on the critical distinction between backward-looking historical volatility and forward-looking implied volatility. Implied Volatility Definition: This defines IV as an annualized percentage representing the market's expectation of future movement. Note the key point that IV is about the stock's potential move, not the option's.
As the video explains, IV is expressed as an annual percentage. An IV of 30% means the market anticipates a 68% probability (one standard deviation) that the stock will trade within a range of +30% to -30% of its current price over the next year. It's a measure of the magnitude of the expected move, not the direction.

Where Does IV Come From? The "Implied" Mechanism
Implied volatility isn't a directly observable metric like a stock's price or volume. It must be "implied" from other known data. Given your IT background, think of this as solving for the single unknown variable in an equation.
Option pricing models, like the famous Black-Scholes model, use several known inputs to calculate a theoretical option price:
- Stock Price
- Strike Price
- Time to Expiration
- Interest Rates
- Dividends
The one major unknown is future volatility. The model can't know how much the stock will move. So, the market works in reverse. It takes the actual, real-world price at which an option is trading on the exchange and asks: "Given this price, what level of future volatility must the market be assuming?" That answer is the implied volatility.
[PDF] MENTAL MODELS FOR VOLATILITY - BetterExplained
This document from BetterExplained provides a clear, non-mathematical overview of the inputs to the Black-Scholes model, highlighting volatility's role.
Review the table under the heading Black-Scholes Model to see the variables. Then, read the section Making Estimates, which succinctly explains the reverse-calculation of IV.
The core takeaway is simple but profound: IV is a direct output of option prices.
- When traders are willing to pay more for options, option prices rise, and therefore IV rises.
- When demand for options falls, their prices drop, and IV drops.
This direct link is what makes IV a powerful gauge of market sentiment.
IV as the Market's "Fear Gauge"
If IV is driven by option prices, what drives option prices? Demand. And what drives demand for options? Fear and uncertainty.
Think about it from an operator's perspective:
- Fear of a Crash: When investors are worried about a market decline, they rush to buy put options to protect their portfolios. This surge in demand drives up the price of puts.
- Anticipation of a Big Move: Before a major known event—like a company's earnings report, a central bank decision, or an inflation data release—traders don't know which way the stock will go, but they expect a large move. They buy both calls and puts to speculate on this volatility. This demand drives up the price of all near-term options.
In both cases, rising option prices lead to rising implied volatility. This is why the CBOE Volatility Index (VIX), which tracks the implied volatility of S&P 500 options, is famously known as the "fear gauge."
Why Does Implied Volatility Increase as Stock Prices Drop?
The tastylive channel is excellent for practical, trader-focused insights. This video explains precisely why volatility rises when markets fall.
Watch these segments carefully: Option Price Indicator: This reinforces that IV is a reflection of option buying and selling, not a cause of it. Complacency vs. Fear: This segment illustrates the classic inverse relationship between the S&P 500 and the VIX. When the market rises, complacency sets in and IV falls. When the market falls, fear takes over and IV spikes. Reasons for the Relationship: This is the critical "why." It explains that because most investors are long, they hedge by buying puts during downturns, which inflates option prices and thus IV.
Reading the Patterns: Volatility Crush and Overstatement
Understanding the mechanism of IV allows you to spot repeatable patterns that trip up retail traders.
1. The Pre-Event Spike and Post-Event "Crush"
This is one of the most reliable phenomena in options trading. Implied volatility consistently rises into a known event and collapses immediately after, once the uncertainty is resolved.
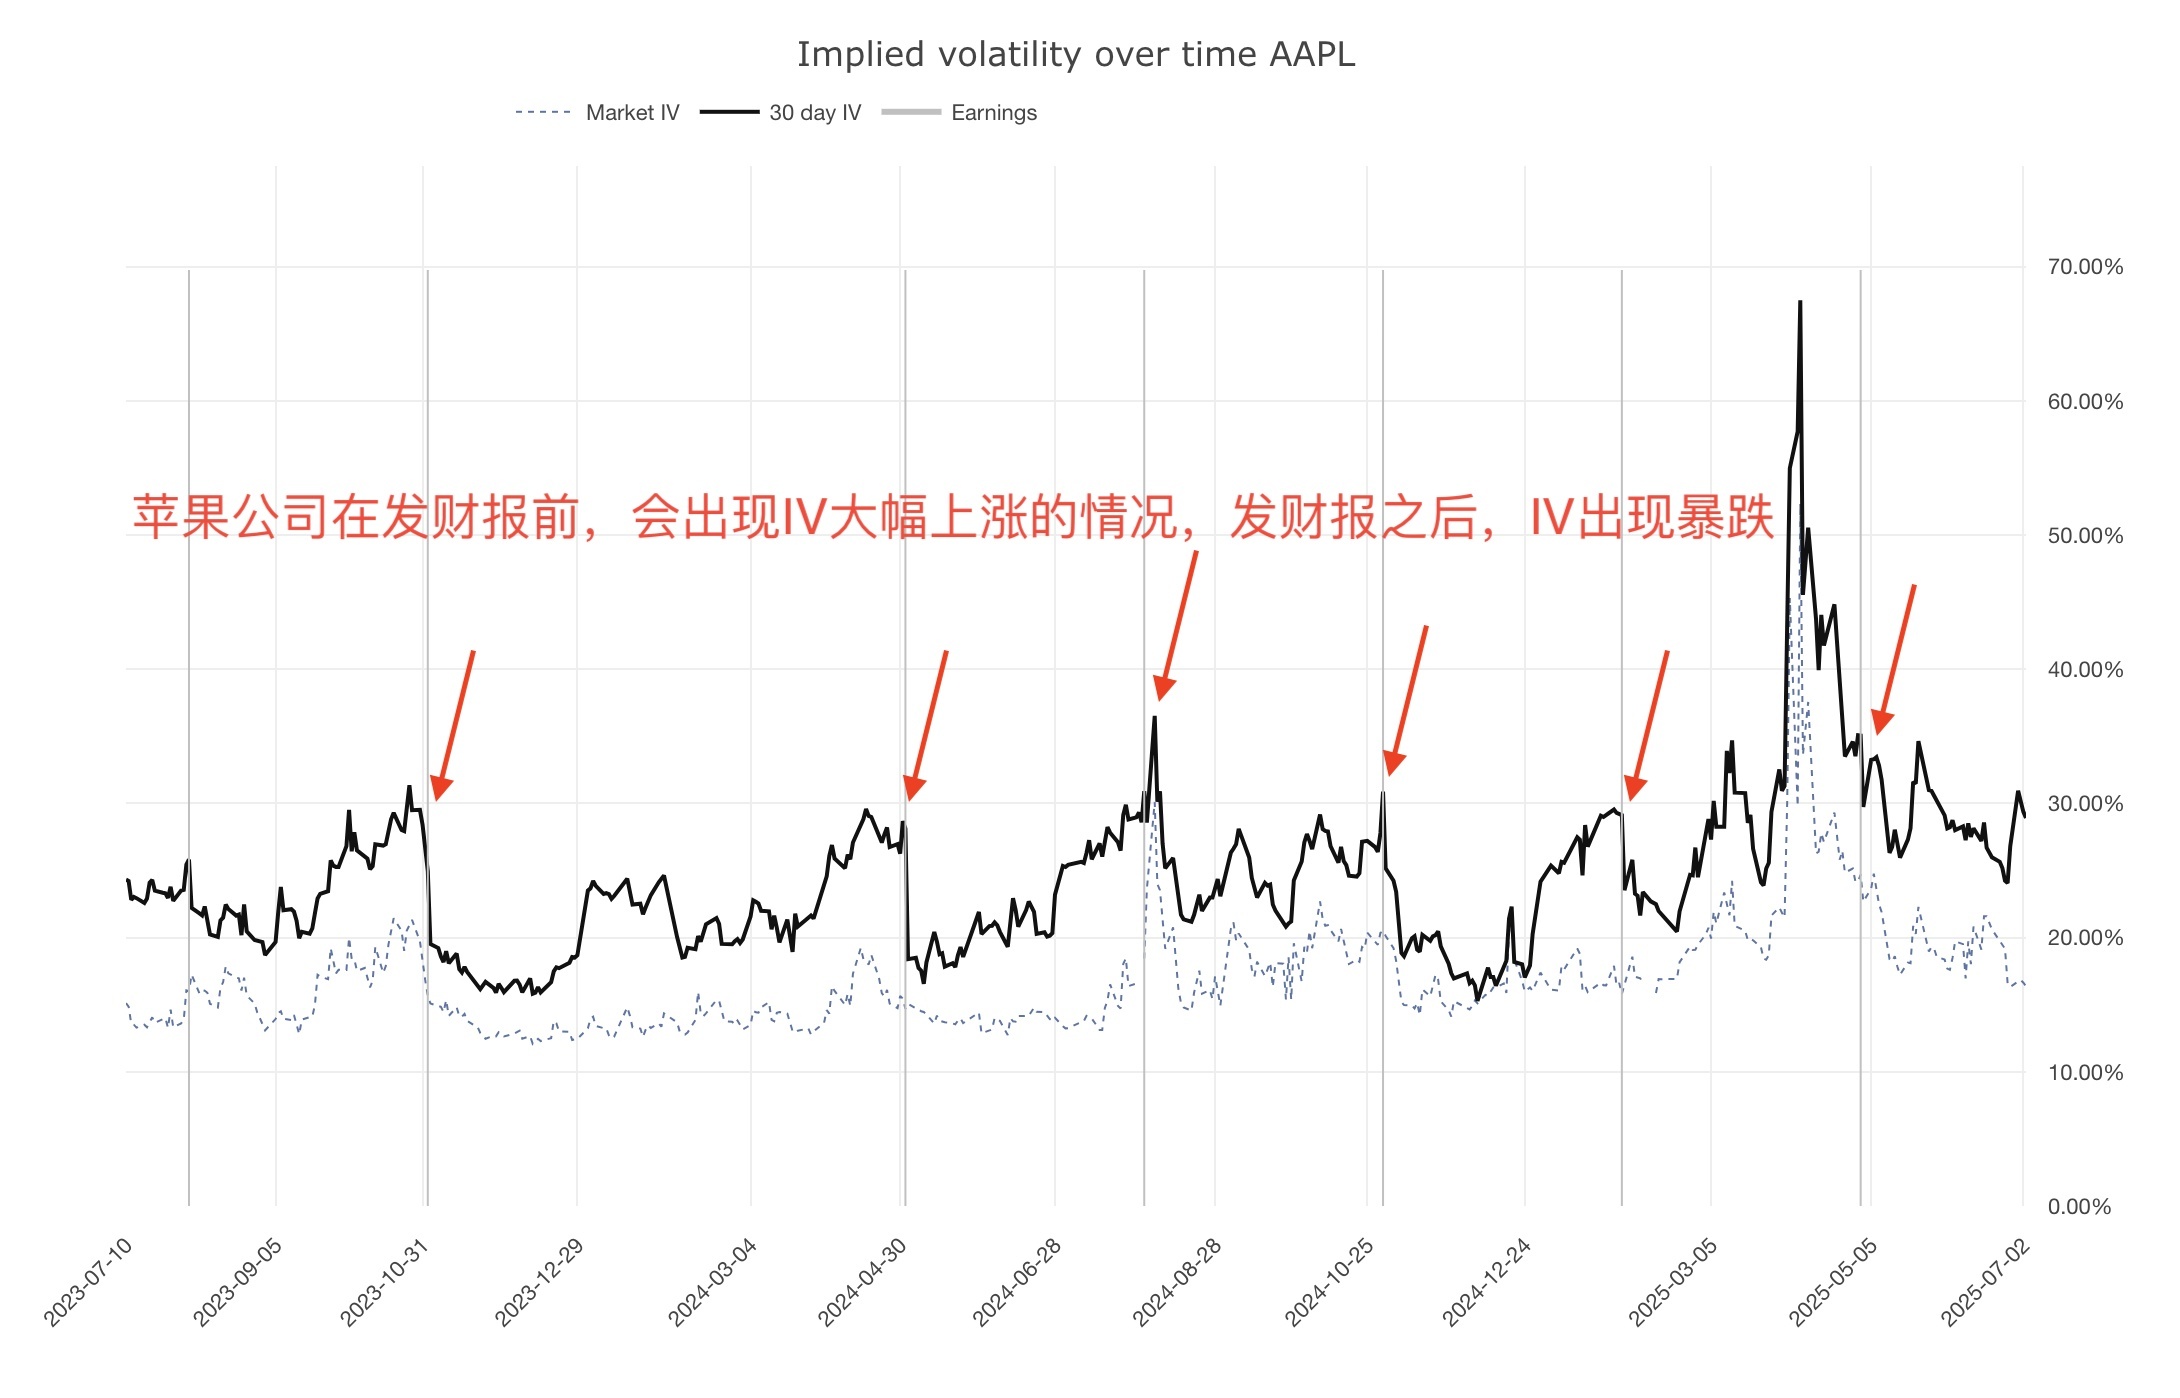
This crush happens regardless of the event's outcome. Whether the earnings are good or bad, the uncertainty premium that was priced into the options evaporates. A trader who buys an option at peak IV just before an event can be right on the direction but still lose money because the collapse in IV destroys the option's extrinsic value.
VIX Index: Why the Fear Gauge Is Really a Suppression Gauge
This article from Mott Capital Management is written from a professional's perspective. It explains volatility dynamics with the precision an operator needs.
Read the section titled The Volatility Crush. It describes this mechanical process perfectly, emphasizing that the outcome matters less than the removal of uncertainty.
2. The Systematic Overstatement of Volatility
Here is another powerful market anomaly: Implied volatility tends to be consistently higher than the volatility that actually materializes (realized volatility). In other words, the market consistently overprices risk. The "insurance" that options provide is, on average, more expensive than the claims paid out.
Implied Volatility Explained: How to Use IV% to Trade Options Smarter
Let's return to the Pandrea Money video for a clear explanation of this phenomenon.
Watch the segment from IV Overestimation. The video states that studies show IV tends to be 1.1x to 1.4x higher than the realized volatility that follows. This is the statistical basis for the risk premium that option sellers aim to capture.
This structural overpricing creates a persistent edge for those who understand it. It's the reason why strategies based on selling expensive options (high IV) are a cornerstone of professional derivatives trading. They are collecting the overpriced insurance premium that the market offers up out of fear and a demand for certainty.
Conclusion
In this lesson, you have learned to see implied volatility not just as a variable in a pricing model, but as the market's pulse. It is the quantifiable expression of collective fear and uncertainty.
Key Takeaways:
- Implied Volatility (IV) is the market's forward-looking, one-standard-deviation estimate of an asset's potential price movement over the next year.
- It is derived from option prices. High option prices, driven by demand from fear or speculation, result in high IV.
- IV acts as a "fear gauge." It typically has an inverse relationship with the market: when prices fall, fear rises, and IV spikes.
- A classic pattern is the "volatility crush," where IV spikes into a known event (like earnings) and collapses afterward, destroying option premium.
- Structurally, IV tends to overestimate realized volatility, creating a risk premium that sophisticated traders can seek to exploit.
We have defined what IV is and how it prices fear. The next logical step is to understand how to measure your portfolio's sensitivity to changes in IV. In our next lesson, we will introduce Vega, the Option Greek that quantifies how much an option's price will change for every 1% change in implied volatility. This will give you the tool to manage volatility risk directly.