Welcome back. In our previous lesson, we established how to measure volatility, which quantifies the magnitude of an asset's price swings. While volatility is a crucial measure of general risk, it doesn't fully capture the experience of a losing period. A strategy can have low volatility on average but still suffer from prolonged, painful drawdowns.
This lesson delves into the metrics that measure this "pain." You will learn to measure drawdown, drawdown duration, and maximum consecutive losses. These concepts are absolutely critical for evaluating the real-world viability of a trading strategy. They move beyond abstract statistics to answer a very practical question: "What is the worst-case losing streak I can expect, and how long might it last?" Understanding this is fundamental to building a system you can stick with, which is a core part of your goal.
The Anatomy of a Drawdown
A drawdown is any decline from a peak in your portfolio's value. The maximum drawdown is the largest single peak-to-trough drop your account has experienced over a period. It represents the most significant loss from a high point before a new high is achieved.
It's a metric that contextualizes returns. A 20% annual return might sound great, but if it came with a 40% maximum drawdown, it would have been an extremely stressful and perhaps unacceptable ride.
The video from the Unbiased Trading channel provides an excellent, trader-focused introduction to why this matters. The presenter shares his own experience with a significant drawdown, highlighting the psychological pressure involved.
The 6 performance metrics behind WINNING in trading.
This video frames drawdown not just as a statistic, but as a lived experience for a trader, which is a crucial perspective.
Watch the section from draw downs. Pay close attention to how he contrasts the final return percentage with the drawdown experienced to achieve it. This distinction is key to assessing risk-adjusted performance.
Calculating Drawdown in Python
Calculating drawdowns is a straightforward process, and with your Python skills, you'll find the vectorized operations in pandas make it very efficient. The logic follows these steps:
- Calculate Returns: Start with a time series of periodic returns (e.g., daily log returns).
- Create a Wealth Index: Convert the returns into a "wealth index" or equity curve. This represents the growth of $1 invested at the beginning of the period. You do this by adding 1 to the returns and then calculating the cumulative product.
- Establish the High-Water Mark: At each point in time, calculate the maximum value the wealth index has reached up to that point. This is the running peak, or "high-water mark."
- Compute Drawdowns: The drawdown at any point in time is the percentage difference between the current high-water mark and the current wealth index.
- Find the Maximum Drawdown: This is simply the largest (most negative) value in the series of drawdowns.
The following video by Daniel Boctor provides a very concise, code-centric walkthrough of this exact process.
Quant Finance with Python and Pandas | 50 Concepts you NEED to Know in 9 Minutes | [Getting Started]
This video is a fast-paced but clear demonstration of the pandas code needed to go from returns to a drawdown plot.
First, watch the brief segment on creating a wealth index. This is the foundational step. Next, watch the core section on calculating and plotting drawdowns. He uses .cummax() to find the high-water mark, which is the key function here.
To summarize the code logic from the video:
# Assuming 'returns' is a pandas Series of daily returns
wealth_index = 1000 * (1 + returns).cumprod()
previous_peaks = wealth_index.cummax()
drawdown = (wealth_index - previous_peaks) / previous_peaks

max_drawdown = drawdown.min()
Measuring Drawdown Duration
A 30% drawdown that recovers in a month is very different from one that lasts for over a year. Drawdown duration measures the length of a drawdown period. It's often defined as the total time from the start of the decline (the peak) until the portfolio recovers to that same peak value. However, in backtesting reports, it often refers to the length of the longest single drawdown event from peak to trough.
Understanding this duration is vital for managing your own expectations and psychological capital. A strategy might be profitable, but if its drawdown periods are longer than your patience, you're likely to abandon it at the worst possible time.
The Unbiased Trading video touches on this important concept.
The 6 performance metrics behind WINNING in trading.
This section extends the drawdown concept to its duration, emphasizing the psychological toll of long losing periods.
Please watch the segment from average draw down duration. The presenter makes a critical point: "mental capital is really as important as financial capital."
For a more structured, code-based implementation, the QuantStart article "Event-Driven Backtesting with Python - Part VII" provides a Python function that calculates both maximum drawdown and its duration.
Event-Driven Backtesting with Python - Part VII
This article presents a clear, albeit non-vectorized, Python function for computing drawdown metrics. It's useful for understanding the step-by-step logic.
First, read the introduction to the performance metrics. Then, study the section on the create_drawdowns function. Notice how it iterates through the equity curve, tracking the high-water mark (hwm) and incrementing a duration counter for every bar the portfolio is below that mark.
The function presented in the article uses a loop. While perfectly functional for understanding the logic, the vectorized pandas approach shown in the video is typically much faster for large datasets.
The final output of a drawdown analysis is often a table summarizing the key events, like the one below.

A Different Kind of Streak: Maximum Consecutive Losses
You specifically mentioned tracking maximum consecutive losses, and this is an excellent and distinct metric to monitor.
- Drawdown measures the decline in capital (your equity curve).
- Maximum Consecutive Losses measures the number of losing trades in a row.
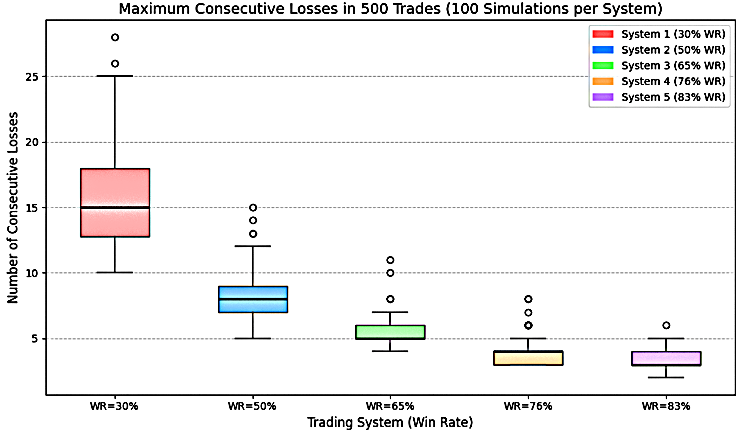
A strategy might have many small, consecutive losses that don't create a large drawdown, or a single disastrous trade that creates a huge drawdown. They measure different aspects of risk. Knowing your strategy can lose, say, 8 times in a row is crucial for maintaining discipline and not losing faith in your system during a losing streak.
The chart below visualizes simulation results for different trading systems. Notice how even a system with a 76% win rate (System 4) can still experience a streak of 5 or more consecutive losses.
Calculating this in Python is a classic "consecutive run" problem. A very clever pandas solution involves identifying where the value of a boolean series changes.
The logic is as follows:
- Create a boolean
SerieswhereTrueis a winning trade andFalseis a losing trade. - Create a new
Seriesthat flagsTrueevery time the value changes (e.g., from win to loss or loss to win). This is done by comparing the series with itsshift()ed version. - Use
cumsum()on this "change" series. This assigns a unique group ID to each block of consecutive identical values. - Group by this ID and get the size of each group.
- Filter for the groups that represent losses and find the maximum size.
This technique is elegantly solved in a Stack Overflow discussion.
python - pandas dataframe - find longest consecutive rows with a certain condition - Stack Overflow
This resource provides a robust pandas-based solution for finding the longest run of a specific value, which is exactly what we need to calculate max consecutive losses.
Focus on the second answer provided by user 'HairyP'. It correctly implements the shift() and cumsum() logic to create groups of consecutive values. Walk through the code and its output to understand how dfBool.cumsum() creates the groups that can then be counted.
Conclusion
In this lesson, we have moved from the general risk measure of volatility to the more visceral and practical metrics of drawdowns and losing streaks.
Here are your key takeaways:
- Maximum Drawdown is the largest peak-to-trough percentage decline in your equity curve, representing the worst loss of capital a strategy has endured.
- Drawdown Duration measures how long a drawdown lasts, providing crucial context on the psychological endurance required to trade a system.
- Maximum Consecutive Losses counts the longest streak of losing trades, offering insight into the frequency of "pain" rather than just its magnitude.
- These metrics are calculated from an equity curve (for drawdowns) or a series of trade outcomes (for consecutive losses), and can be computed efficiently using
pandas.
You are now equipped to quantify not just the potential returns of a strategy, but also the nature and severity of the risks involved. This is an essential skill for any quantitative trader.
In our next lesson, we will combine these concepts. We'll explore powerful risk-adjusted return metrics like the Sharpe, Sortino, and Calmar Ratios, which use volatility and drawdown to create a single number that measures how much return you get for the risk you take.