Hello! Welcome to the third lesson in our module on the genetic basis of PCOS.
In our last lesson, we established that PCOS is a heritable condition. Evidence from familial aggregation (PCOS running in families) and twin studies (higher concordance in identical vs. fraternal twins) strongly indicates that genetics play a major role in determining who is susceptible to developing the syndrome.
However, this leaves us with a crucial question: if genes are involved, which ones? Today, we will explore the powerful research method scientists use to hunt for these genes across the entire human genome. Our learning outcome is to outline the methodology of genome-wide association studies (GWAS) and their role in identifying PCOS susceptibility loci.
This lesson will guide you through:
- The fundamental principles and steps of a Genome-Wide Association Study (GWAS).
- How to interpret the primary visual output of a GWAS: the Manhattan plot.
- The key genetic regions (loci) that GWAS have linked to PCOS.
- How these genetic findings are beginning to explain the underlying biology of hyperandrogenism, anovulation, and metabolic issues in PCOS.
1. Finding the "Needle in a Haystack": The GWAS Approach
Imagine you want to find the genetic factors for a complex disease like PCOS. The human genome contains about 3 billion DNA base pairs. Searching through all of that for tiny, relevant differences is a monumental task. Genome-Wide Association Studies (GWAS) were developed to tackle this challenge in an efficient, hypothesis-free way.
The core idea is to compare the genomes of two large groups of people:
- Cases: Individuals who have the disease or trait of interest (e.g., women diagnosed with PCOS).
- Controls: Similar individuals who do not have the disease.
The study then looks for specific genetic variations that are significantly more common in the "cases" group than in the "controls." To understand how this works, let's first review the most common type of variation studied in GWAS.
Single Nucleotide Polymorphisms (SNPs)
As we touched upon in the last lesson, a Single Nucleotide Polymorphism (SNP)—pronounced "snip"—is a variation at a single position in a DNA sequence among individuals. For example, at a specific spot in the genome, most people might have a 'G' nucleotide, but a minority might have a 'T'.
SNPs are perfect markers for GWAS because they are abundant (millions exist across the genome) and can be measured quickly and cheaply using technology called microarray chips.
To get a clear overview of the GWAS method, please watch the first part of this introductory video.
Genome-Wide Association Studies (GWAS), Part 1
The video 'Genome-Wide Association Studies (GWAS), Part 1' from the channel Biology For All provides a very clear, step-by-step introduction to the core concepts behind GWAS.
Please watch from the beginning until 07:43. Focus on: The definition of a polymorphism and a SNP (0:00 - 03:21). The difference between a rare mutation and a common SNP (03:21 - 05:51). The basic case-control design of a GWAS (05:51 - 07:43).
2. The GWAS Workflow and Visualizing Results
The video you just watched outlined the basic study design. Let's formalize the steps and look at how the massive amount of data generated is visualized.

As shown in the diagram and the video, the final results of a GWAS are typically displayed in a Manhattan plot. Let's learn how to read it.
Genome-Wide Association Studies (GWAS), Part 1
Let's return to the 'Genome-Wide Association Studies (GWAS), Part 1' video to understand how to interpret a Manhattan plot.
Please watch the segment from 07:43 to 10:09. Pay close attention to: The layout of the x-axis (chromosomes) and y-axis (statistical significance). What the 'skyscrapers' or peaks represent. The concept of an 'association study' – it points to a region, not a specific cause.
To summarize the key features of a Manhattan plot:
- X-axis: The human chromosomes, laid out end-to-end (from 1 to 22, and sometimes X/Y). Each dot on the plot represents one SNP that was tested.
- Y-axis: This shows the statistical significance of the association for each SNP. It's plotted as the negative logarithm of the p-value (-log₁₀(p)). A smaller p-value (stronger evidence for an association) results in a larger -log₁₀(p) value, so higher dots mean stronger associations.
- Significance Threshold: A horizontal line is drawn on the plot (usually at a -log₁₀(p) of around 7-8). Any SNP whose dot rises above this line is considered "genome-wide significant," meaning the association is very unlikely to be due to random chance.
Test your understanding!
Imagine you are looking at a Manhattan plot from a GWAS for a certain disease. You see a very tall 'skyscraper' of dots on chromosome 11 that clearly crosses the genome-wide significance line. Can you conclude that a gene within that skyscraper peak directly causes the disease? Why or why not?
Show answer
No, you cannot conclude that a gene in that region is the direct cause. GWAS identifies associations, not causation. The highly significant SNPs in that peak are acting as statistical pointers to a specific chromosomal region, or locus. The actual disease-causing variant might be one of those SNPs, or it could be another nearby variant that wasn't measured but is often inherited along with the markers (a phenomenon called linkage disequilibrium). This significant finding is a crucial starting point that tells researchers, "Look here! This region is important," prompting further investigation to find the specific causal gene and mechanism.
3. What GWAS Have Revealed About PCOS
Now that we understand the methodology, let's look at what this powerful tool has taught us about PCOS. Since the first GWAS for PCOS was published in 2011, numerous studies involving tens of thousands of women have identified several genetic loci consistently associated with the syndrome.
Please read the following sections from a review article that summarizes these key findings.
The Role of Gene Alterations in the Pathogenesis of Polycystic ...
The paper 'The Role of Gene Alterations in the Pathogenesis of Polycystic ...' provides an excellent summary of the major findings from GWAS in PCOS and categorizes them by their biological function.
Please read Section 2, 'Genome-Wide Association Studies,' including its subsections 2.1, 2.2, and 2.3. Focus on understanding: The general findings of the first GWAS in PCOS. The names of a few key susceptibility genes that are repeatedly mentioned, like DENND1A, THADA, and FSHB. How these genes are linked to the main features of PCOS (hyperandrogenism, anovulation, and insulin resistance).
The reading highlights that GWAS has successfully pinpointed several susceptibility loci for PCOS. These are not "PCOS genes" that cause the disease on their own, but rather genetic variations that slightly increase a person's risk.
Here are some of the most important loci identified and their proposed roles:
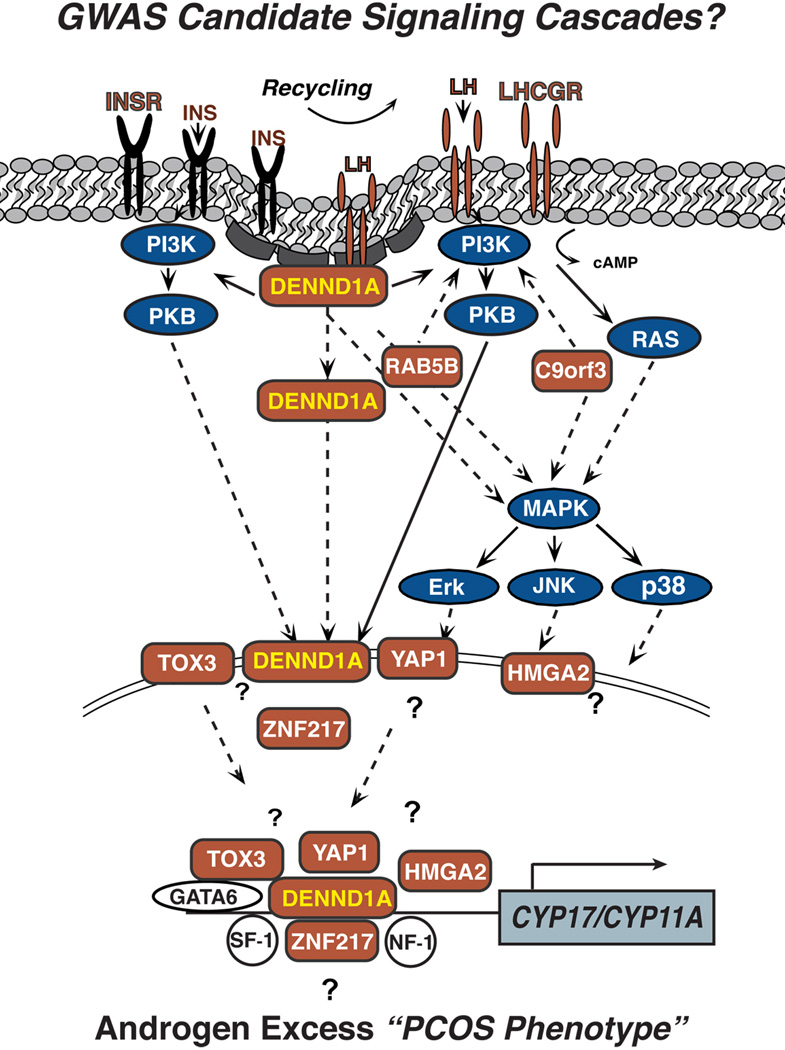
DENND1A: This is one of the most significant findings. This gene is involved in the regulation of ovarian theca cells, which are responsible for producing androgens. Variations inDENND1Aare strongly linked to the hyperandrogenism (excess androgen) characteristic of PCOS.THADA: This gene has been associated with insulin secretion and action. Its link to PCOS suggests a genetic component to the insulin resistance and metabolic dysfunction often seen in the syndrome.FSHB: This gene codes for the beta-subunit of Follicle-Stimulating Hormone (FSH). Variations here can affect gonadotropin levels, potentially contributing to the abnormal LH/FSH ratio and problems with follicle development (anovulation).LHCGR: This gene codes for the receptor for Luteinizing Hormone (LH). Variations in this gene can alter the ovary's response to LH, influencing androgen production and ovulation.
The image below shows a hypothesis of how some of these GWAS-identified genes, particularly DENND1A, might fit into the molecular pathways leading to androgen excess in PCOS.
Conclusion
In this lesson, we demystified the powerful technique of Genome-Wide Association Studies and saw how it has been applied to uncover the genetic underpinnings of PCOS.
Key Takeaways:
- GWAS is a research method that scans the genomes of many people to find common genetic variations (SNPs) associated with a particular disease.
- The basic design compares a case group (with the disease) to a control group (without the disease) to find SNPs that are more frequent in cases.
- Results are displayed on a Manhattan plot, where high peaks point to chromosomal regions (loci) strongly associated with the disease.
- Importantly, association is not causation. GWAS identifies regions for further study.
- In PCOS, GWAS has successfully identified several key susceptibility loci, including
DENND1A(linked to hyperandrogenism),THADA(linked to metabolism), andFSHB(linked to gonadotropin regulation).
Preview of the Next Lesson:
GWAS is excellent at finding variations in the DNA sequence itself. However, heritability studies suggest these common variants don't tell the whole story. In our next lesson, we will explore epigenetics. We will learn about mechanisms that can change how genes are expressed without altering the DNA code, adding another critical layer to our understanding of how PCOS develops.