Welcome back, Detective. The ink is barely dry on our report for the "Disappearing Clients" case, and already a new file has landed on your desk. This one comes with a sense of urgency and internal strife. The case is titled "The Arrangement Dispute."
A Cold Opening: The Feud at Elysian Moments
Your new client is the owner of "Elysian Moments," a high-end consultancy and studio specializing in curated relationship experiences. The studio's success is built on its three flagship packages: the "Dedicated Vixen" (a one-on-one dynamic), the "Shared Muse" (a polyandrous arrangement), and the more traditional "Monogamous Pairing."
The problem? The studio's two top consultants, Anya and Ben, are at war. Anya, the architect of the "Dedicated Vixen" package, insists her clients report the highest satisfaction. Ben, who champions the "Shared Muse" dynamic, claims his approach is superior. Both have come to the owner armed with charts and anecdotal evidence. The conflict is threatening to tear the team apart.
They have provided you with a small, clean dataset containing satisfaction scores (on a scale of 1 to 10) from an equal number of clients in each of the three arrangements. Your mission is not to take sides, but to act as the impartial arbiter. You must determine if the type of relationship arrangement has a genuine, systematic effect on client satisfaction, or if the differences Anya and Ben are seeing are simply the result of random chance and individual personalities.
The Strategy: Partitioning the Evidence
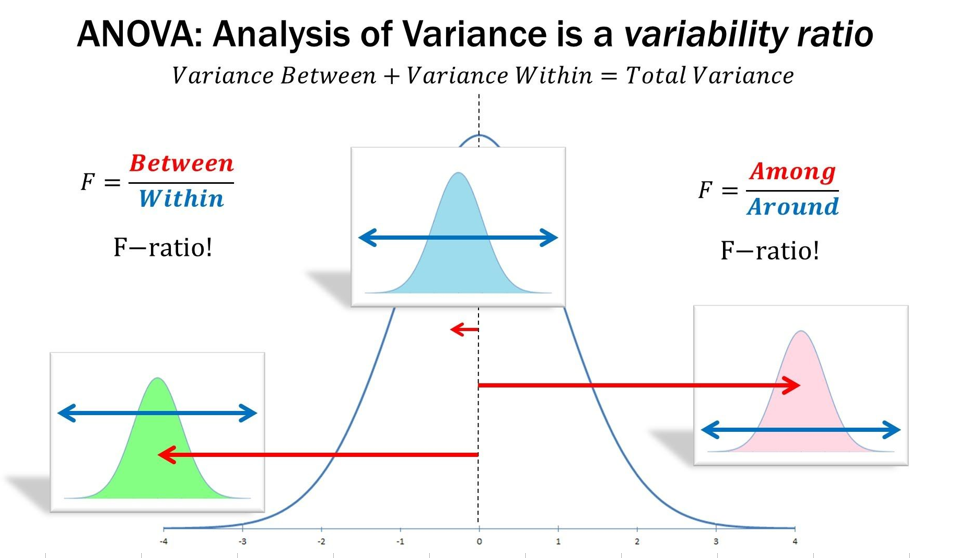
To settle this dispute, comparing the average satisfaction scores of the groups is a start, but it doesn't tell the whole story. Averages can be misleading. The real key lies in understanding the sources of variation in the data. Think of the total variation in all the satisfaction scores as a single pie. Our first task is to slice that pie into two meaningful pieces:
- Between-Group Variation: How much of the total variation can be explained by the fact that the scores come from three different arrangement types? This is the variation between the group averages.
- Within-Group Variation: How much variation is due to random differences between individuals within the same arrangement type? This is the natural, "noise" level of variation.
If the variation between the groups is large compared to the variation within the groups, it suggests the arrangement type genuinely matters. If the variation between groups is small, then the observed differences are likely just noise, and the consultants' feud is based on nothing more than random fluctuations. This method of partitioning variance is the heart of a technique known as Analysis of Variance, or ANOVA.
Breaking Down the Numbers: Sums of Squares
To quantify these sources of variation, we use a concept you'll be very familiar with from your statistical background: the Sum of Squares. We need to calculate three key values from the case data.
Let's use the satisfaction scores from the Elysian Moments case file:
- Group 1 (Dedicated Vixen): 8, 9, 7, 8
- Group 2 (Shared Muse): 6, 7, 5, 6
- Group 3 (Monogamous Pairing): 4, 5, 3, 4
The following guide from the statsandr blog provides an excellent walkthrough for performing these calculations by hand. We will follow its logic precisely.
How to: one-way ANOVA by hand - Stats and R
This resource breaks down the required calculations into clear, manageable steps. We'll use it to process the evidence from the Elysian Moments case.
First, read the section on "Overall and group means". Use this method to calculate the mean satisfaction for each of the three arrangement groups and the overall mean for all 12 clients. Next, study the section titled "SSR and SSE". Pay close attention to the two distinct calculations: SSR (Sum of Squares Regression), which we will call Sum of Squares Between (SSB). This measures the variation between the groups. SSE (Sum of Squares Error), which we will call Sum of Squares Within (SSW). This measures the variation within the groups. Apply these formulas to our case data.
Let's perform the autopsy on the numbers together.
1. Calculate the Means:
- Group Means:
- Dedicated Vixen ():
- Shared Muse ():
- Monogamous Pairing ():
- Overall Mean ():
2. Calculate Sum of Squares Between (SSB):
This calculation quantifies the variation of each group's mean from the overall mean, weighted by the number of clients in each group.
Where is the number of groups, is the size of group , and is the mean of group .
- Group 1:
- Group 2:
- Group 3:
- SSB = 16 + 0 + 16 = 32
3. Calculate Sum of Squares Within (SSW):
This calculation quantifies the variation of each individual score from its own group's mean.
- Group 1 (mean=8):
- Group 2 (mean=6):
- Group 3 (mean=4):
- SSW = 2 + 2 + 2 = 6
To confirm our work and see the formulas presented slightly differently, you can consult this second resource.
How to compute the sum of squares in ANOVA
This guide from Statkat provides a very direct, formula-based explanation for calculating SSW and SSB. It's a great way to double-check our understanding.
Focus on the first section, "method 1". Compare the formulas and steps shown there to the calculations we just performed on the Elysian Moments data. Notice that they arrive at the same components, just via slightly different notation.
The Full Picture: Total Sum of Squares (SST)
The final piece of the puzzle is the Total Sum of Squares (SST), which represents the total variation in the dataset—the variation of every single score from the overall grand mean.
If you were to calculate this for our data, you would find SST = 38.
Notice the fundamental identity of ANOVA:
Our calculations hold up. We have successfully partitioned the total variance.
Preliminary Findings
Here is what we've discovered so far:
- The Total Sum of Squares (SST) in the satisfaction data is 38. This is our total "pie."
- The Sum of Squares Between groups (SSB) is 32. This means that a large portion of the total variation in satisfaction scores appears to be attributable to the differences between the three arrangement types.
- The Sum of Squares Within groups (SSW) is 6. The variation from individual differences within each arrangement type is comparatively small.
Visually, we have sliced our pie. The "Between-Group" slice (32) is much larger than the "Within-Group" slice (6). This provides our first strong clue that the type of relationship arrangement does genuinely matter and that the dispute between Anya and Ben is not just about random noise.
Conclusion
In this session, we have taken the first critical step in resolving "The Arrangement Dispute." We have moved beyond simple averages and delved into the structure of the data's variability. By applying the foundational principles of ANOVA, we have successfully decomposed the total variation in client satisfaction scores into its constituent parts: the variation between the arrangement types and the variation within them.
Our key takeaways are:
- The core idea of ANOVA is to partition the total variance of a dataset.
- We quantify this variation using Sums of Squares: Total (SST), Between groups (SSB), and Within groups (SSW).
- These components are linked by the fundamental equation: .
- By calculating SSB and SSW, we have established that most of the variation in the Elysian Moments data seems to come from differences between the groups, not within them.
Preview of the Next Session
We have a strong suspect—the relationship arrangement type—but we have not yet proven our case beyond a reasonable doubt. Simply observing that SSB is larger than SSW is not enough to make a formal statistical conclusion. In our next session, we will complete the analysis. We will use the SSB and SSW values we've calculated to compute the F-statistic, the ultimate ratio of between-group to within-group variance. We will then use this statistic to perform a formal hypothesis test, allowing us to report back to the owner of Elysian Moments with a definitive, data-backed verdict.