Welcome back, Detective. In our last session, we uncovered the first major cracks in the ErosEncore app's facade. By comparing their marketing claims to the cold, hard data from your client files, we discovered their real-world sensitivity (90%) and specificity (80%) fall far short of their advertised 98% and 95%.
This is a strong lead, but it's not the whole story. To build an undeniable case, we need to move beyond these intrinsic test properties and look at the results from the perspective of your clients. What is the actual, practical reliability of the app's recommendations? Today, we will organize our findings into the standard investigative framework for this kind of analysis—the confusion matrix—and compute a full suite of diagnostic metrics. This will give us the quantitative firepower to assess the true damage this "Screening Scandal" is causing.
Organizing the Clues: The Confusion Matrix
The first step is to structure the evidence in a clear, standardized way. For this, we use a 2x2 confusion matrix. This simple table cross-tabulates the app's predictions ("Test result") against the ground truth ("Disease" or, in our case, genuine compatibility).
Here is the standard layout for this tool. It categorizes every outcome into one of four buckets: True Positive, False Positive, False Negative, or True Negative.
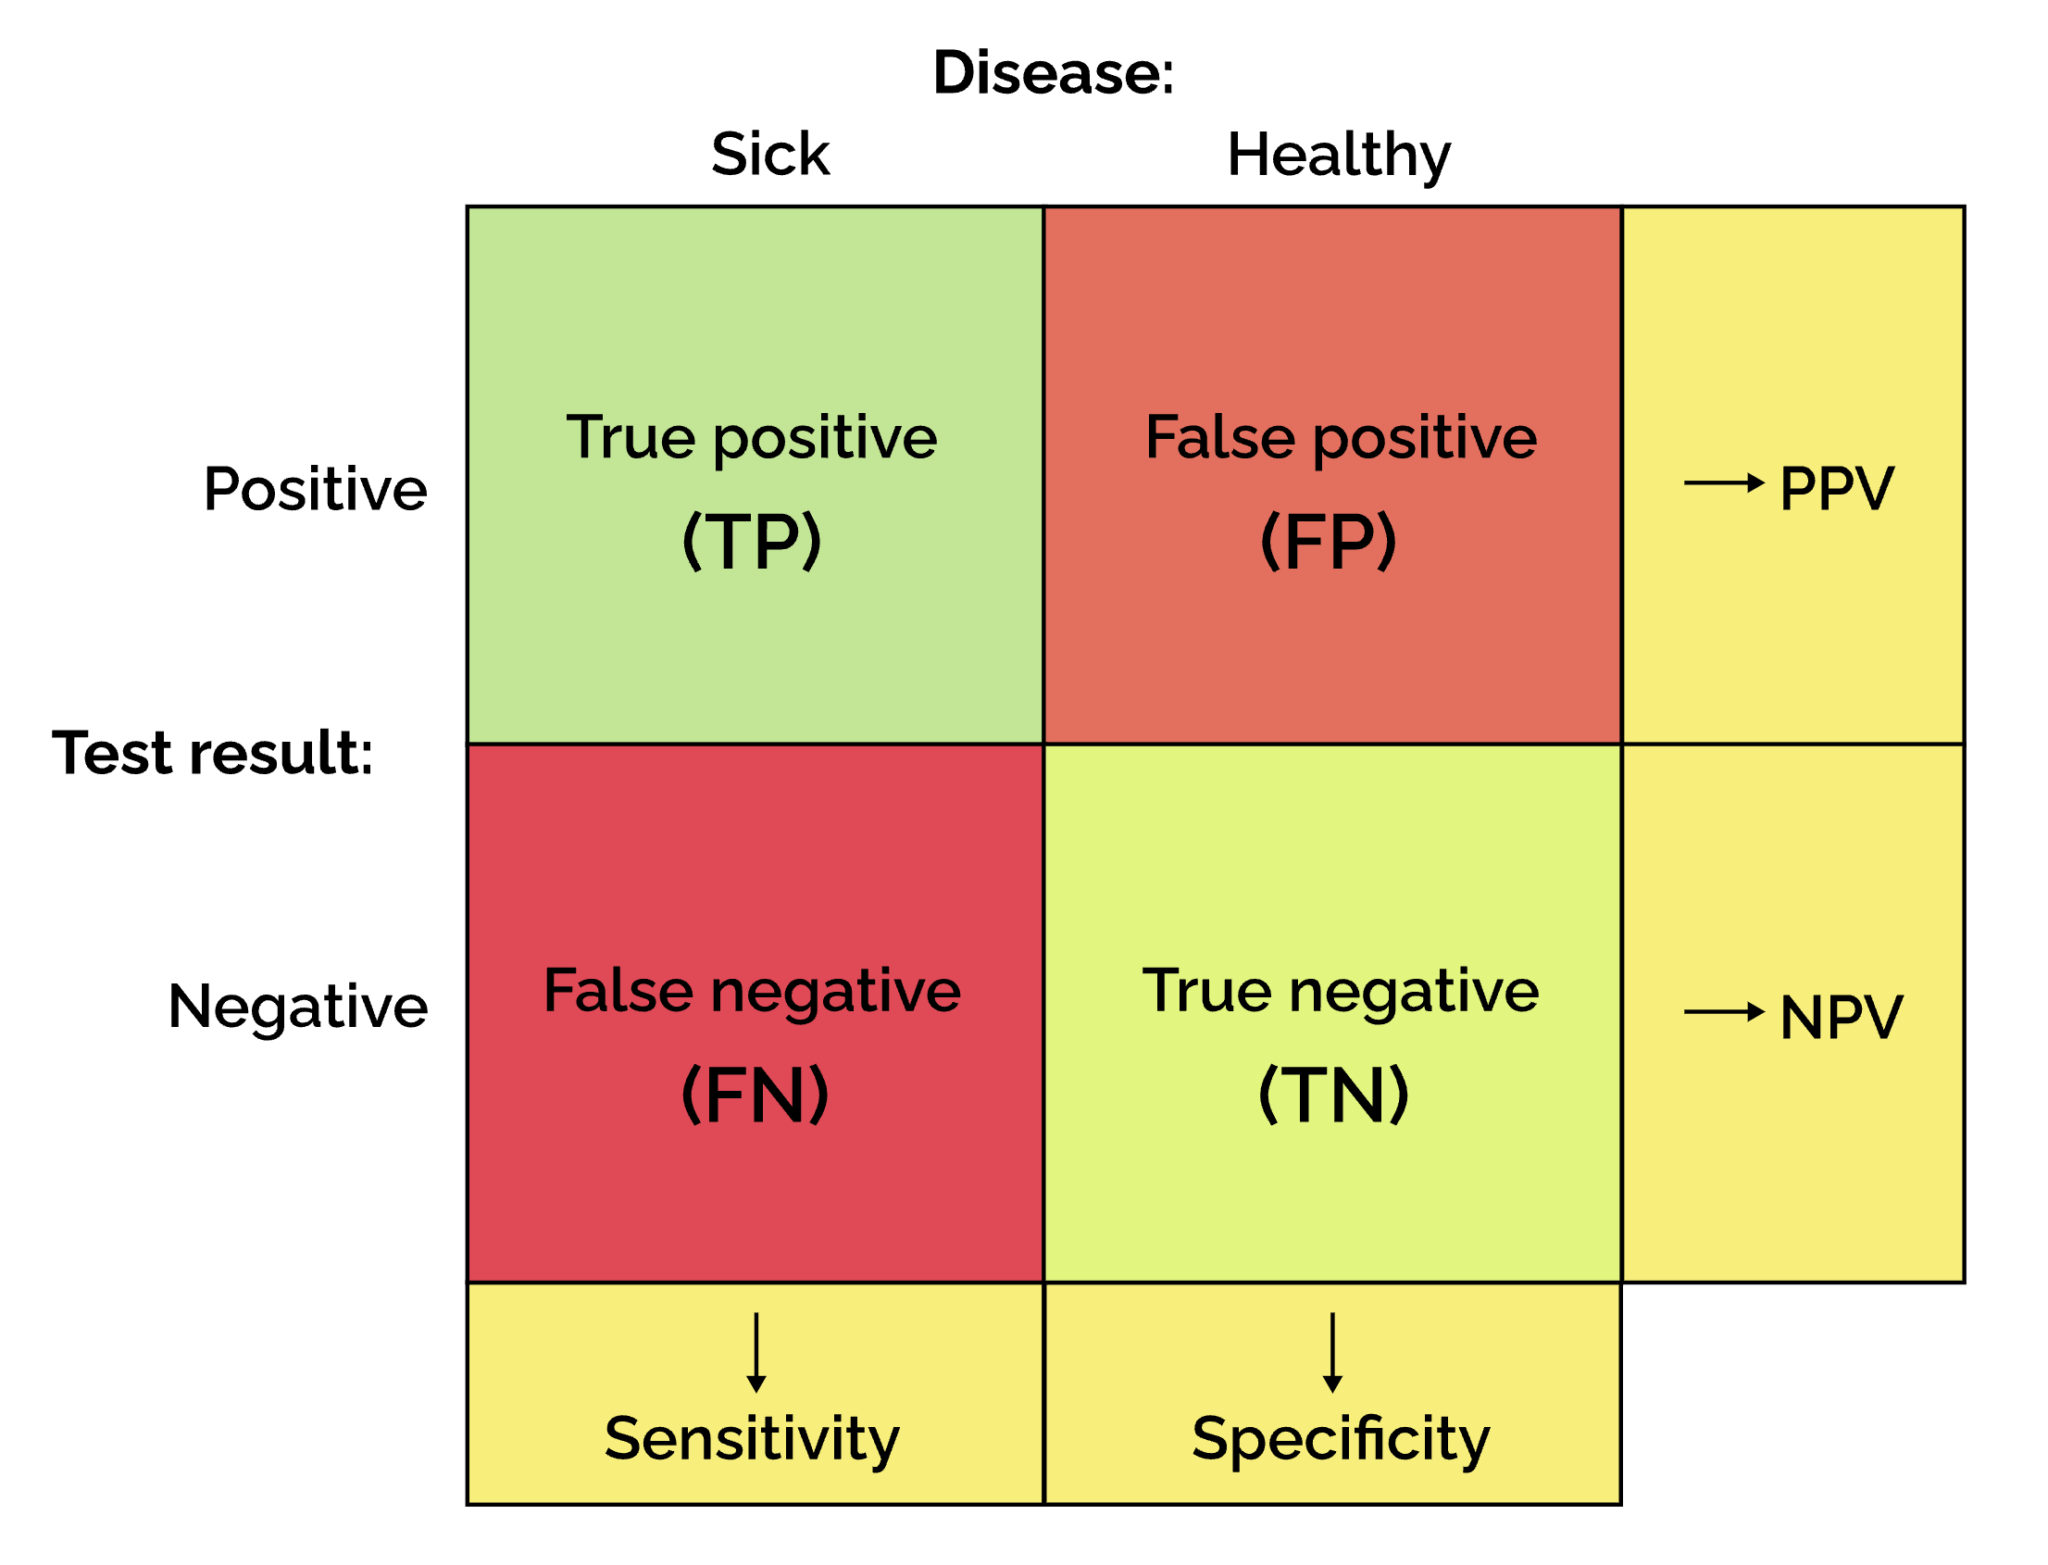
From our last session, we have the counts for each of these categories based on your review of 200 couples:
- True Positives (TP): 27 (App said "Compatible," and they were)
- False Positives (FP): 34 (App said "Compatible," but they were not)
- False Negatives (FN): 3 (App said "Incompatible," but they were compatible)
- True Negatives (TN): 136 (App said "Incompatible," and they were not)
Let's place these numbers into the matrix to get a clear picture of the situation:
| Genuine Compatibility: YES | Genuine Compatibility: NO | Row Total (Test Predictions) | |
|---|---|---|---|
| App: Compatible | TP = 27 | FP = 34 | 61 |
| App: Incompatible | FN = 3 | TN = 136 | 139 |
| Column Total (Ground Truth) | 30 | 170 | Total: 200 |
With the evidence organized, we can now calculate a more comprehensive set of metrics that tell us not just how the test performs in theory, but what its results mean in practice.
For a fun way to remember how to set up this matrix and derive the formulas, the following video offers some clever mnemonics.
Sensitivity, Specificity, PPV, NPV
The "Dirty Medicine" channel provides a highly practical and memorable method for constructing the 2x2 table and recalling the formulas for its key metrics.
Watch from the beginning to understand the setup of the table. Then, you can see the mnemonics for deriving the formulas for sensitivity, specificity, PPV, and NPV. The final summary ties it all together.
The View from the Inside: Predictive Values
While sensitivity and specificity are about the test's ability to find or rule out a condition, your clients are asking a different, more personal question: "The app says this match is 'Compatible.' What's the chance it's right?" This is measured by the Positive Predictive Value (PPV). Conversely, the Negative Predictive Value (NPV) answers the question: "If the app says 'Incompatible,' what's the chance it's right?"
These metrics are calculated from the rows of our confusion matrix.
-
Positive Predictive Value (PPV): Of all the times the app declared a match "Compatible," what fraction was actually compatible?
-
Negative Predictive Value (NPV): Of all the times the app declared a match "Incompatible," what fraction was actually incompatible?
Let's calculate these for ErosEncore:
This PPV result is the smoking gun. It means that when a user receives a "Compatible" notification from ErosEncore, there is only a 44.3% chance that the match is genuine. In other words, the app's positive recommendations are wrong more often than they are right (a 55.7% chance of being a false positive). This finding directly and quantitatively explains the wave of complaints you've been receiving.
The NPV, on the other hand, is very high. When the app dismisses a pairing, it's correct almost 98% of the time. While this is good, it doesn't help the users who are being led astray by false promises of compatibility.
The Overall Verdict: Accuracy vs. Reality
A defender of ErosEncore might point to one final metric: Overall Accuracy. This measures the proportion of all judgments that were correct.
- Accuracy:
For ErosEncore, the accuracy is:
An 81.5% accuracy rate might sound respectable on the surface. However, you know from your background with imbalanced datasets that accuracy can be a deeply misleading metric. Our sample has a low base rate of compatibility (15%). The high accuracy score is largely driven by the algorithm's ability to correctly identify the numerous incompatible pairs (136 True Negatives). It completely obscures the disastrous performance when it comes to identifying the rare, sought-after compatible matches. A classifier that simply labeled everyone as "Incompatible" would achieve 170/200 = 85% accuracy, yet be utterly useless.
To formalize your understanding of this full suite of metrics, the following resources provide clear definitions, formulas, and discussions of their interpretation.
measures-derived-from-a-2-x-2-table-for-an-accuracy-of-a- ...
This paper from the Journal of Biometrics & Biostatistics provides a formal overview of the metrics derived from a 2x2 table. It's a solid reference for the definitions and formulas we're using.
Review Table 2 for the standard notation. Then, read the definitions and formulas for Predictive Values and for Diagnostic Accuracy and Misclassification Rate. Pay close attention to the discussion of how prevalence affects PPV.
The next resource reinforces these concepts and specifically addresses the pitfalls of relying on accuracy alone.
Evaluating Machine Learning Models and Their Diagnostic ...
This chapter from a book on Machine Learning in Health provides excellent, concise summaries and discusses the exact issues we're facing in our investigation.
Start by reviewing the definitions of the confusion matrix components. Then, study Box 1, which gives a very clear summary of all the key formulas. Finally, read the section on the pitfalls of summary metrics like accuracy, especially in imbalanced datasets.
Conclusion: The Case Takes Shape
Our investigation has taken a major step forward. By organizing the raw data into a confusion matrix, we have moved beyond simple discrepancies to a full quantitative indictment of the ErosEncore app's performance.
Key Takeaways:
- The confusion matrix is the standard tool for structuring the results of a classification or screening test.
- Predictive Values (PPV and NPV) measure the real-world reliability of a test's results from the user's perspective.
- The ErosEncore app has an alarmingly low PPV of 44.3%, meaning its "Compatible" matches are more likely to be false than true. This is the primary evidence explaining client complaints.
- Overall Accuracy can be a misleading metric in cases with a low base rate (imbalanced data), as it is inflated by the large number of true negatives and can hide poor performance on the positive class.
We have established what is happening. The next logical question is why. The low PPV isn't just a result of mediocre sensitivity and specificity; it's being powerfully driven by the low base rate of compatibility (15%) in the population. In our next session, we will wield one of the most fundamental tools in your arsenal—Bayes' theorem—to formally connect these concepts and demonstrate precisely how the low prevalence guarantees a high number of false positives, sealing the case against ErosEncore.