Welcome back, Detective. In our last debriefing, we landed a heavy blow against ErosEncore. By constructing a confusion matrix from your client data, we calculated the app's Positive Predictive Value (PPV) to be a dismal 44.3%. This means a "Compatible" match is more likely to be wrong than right—a fact that perfectly explains the flood of client complaints.
We've established what is happening. Today, we delve into the why. The app's poor sensitivity and specificity are only part of the story. The real culprit, as you likely suspect from your work with imbalanced data, is the low prevalence of genuine compatibility. Our objective is to use one of the most powerful tools in probabilistic reasoning—Bayes' theorem—to formally connect the dots. We will prove, mathematically, how the low base rate of compatibility makes the app's high-flying claims impossible and its poor real-world performance inevitable.
From Raw Numbers to Probabilistic Reasoning
In our last session, we calculated PPV directly from the counts in our confusion matrix:
This is a calculation after the fact. A more fundamental approach is to think in terms of probabilities from the start. This allows us to see how the different components—prevalence, sensitivity, and specificity—interact.
This process can be visualized as a decision tree, where each branch represents a probability.
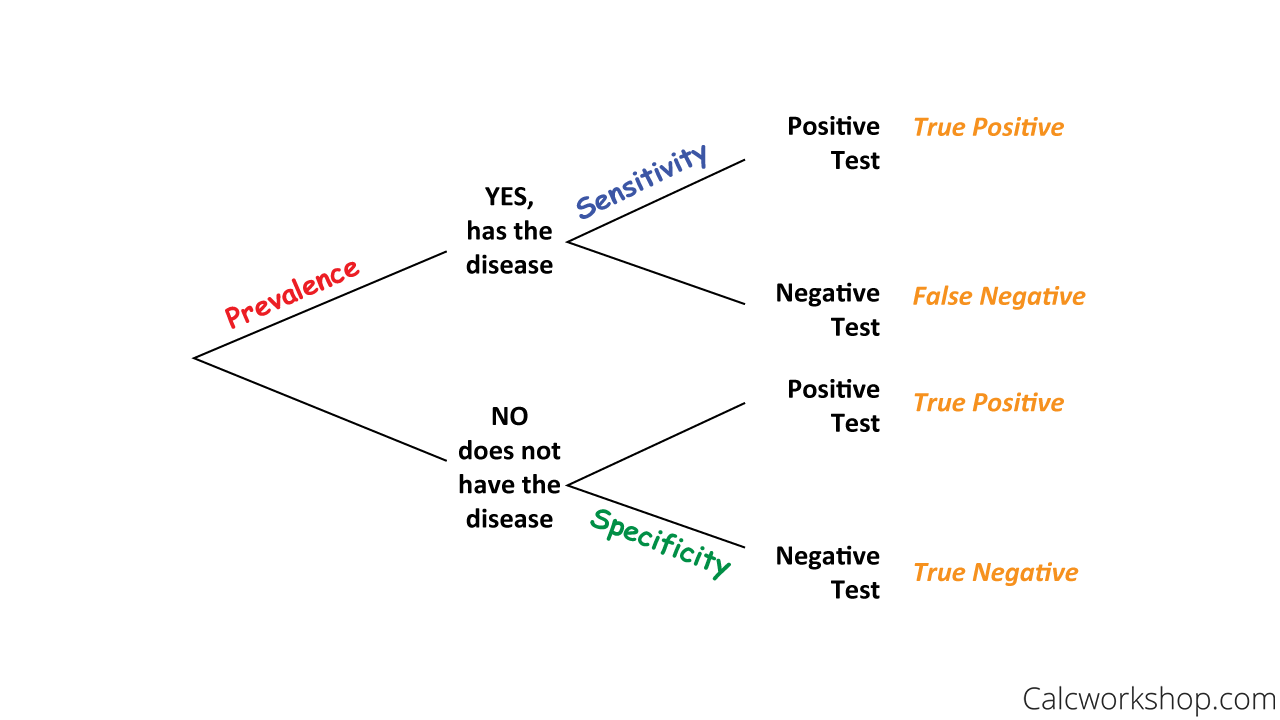
The question we're asking is: "Given that a client received a positive test result, what is the probability they actually have the condition?" This is a classic conditional probability problem, and it is the very question that Bayes' theorem is designed to answer.
In this context, Bayes' theorem can be expressed directly as a formula for PPV:
This might look familiar. The numerator is the probability of a true positive occurring in the general population. The denominator is the total probability of any positive test, whether it's a true positive or a false positive. The formula is simply the ratio of true positives to all positives, expressed in terms of probabilities instead of counts.
The following resource provides a clear explanation of this formula.
Sensitivity vs Specificity and Predictive Value
This article from Statistics How To gives a straightforward presentation of the two common ways to calculate PPV. We've already used the first method (from counts); now we'll focus on the second.
Focus on the section Calculating the Positive Predictive Value. Pay close attention to the second formula provided, which uses sensitivity, specificity, and prevalence. This is the version of Bayes' theorem we'll be using.
Let's use this formula to confirm our previous finding. Using the observed values from your 200-couple investigation:
- Prevalence (our prior belief) = 0.15
- Sensitivity = 0.90
- Specificity = 0.80
Plugging these into the formula:
This is the same 44.3% we found before. We have now formally demonstrated that the low PPV is a direct mathematical consequence of the test's performance characteristics and the low base rate of compatibility.
The Anatomy of the Deception
Now for the crucial step in our case. Let's step into the shoes of an unsuspecting client. They see ErosEncore's marketing, which claims 98% sensitivity and 95% specificity. They don't know the app's real-world performance is much worse, nor do they likely appreciate the powerful effect of the 15% base rate.
What PPV would these claimed numbers produce? Let's run the calculation again, this time using ErosEncore's claimed accuracy but the true prevalence:
- Prevalence = 0.15
- Claimed Sensitivity = 0.98
- Claimed Specificity = 0.95
This reveals the core of the scandal. Even under ideal conditions (if the app's claimed accuracy were true), a "Compatible" result would only correspond to a 77.6% chance of genuine compatibility, not 98%. When you factor in the app's actual lower performance (90% sensitivity, 80% specificity), that chance plummets to 44.3%.
This discrepancy between the test's accuracy (high 90s) and its predictive value (low 40s) is a classic statistical pitfall known as the base rate fallacy or the "Bayesian trap." The following video gives an excellent, intuitive explanation of why this happens.
This video from Veritasium, "The Bayesian Trap," perfectly illustrates the paradox we've uncovered. It uses a medical testing scenario to show how a highly accurate test for a rare condition can produce an alarmingly high number of false positives.
Watch from the setup, which mirrors our case with a rare condition and a seemingly accurate test. The video then introduces Bayes' Theorem and plugs in the numbers to reveal the surprisingly low posterior probability. The real insight comes from the natural frequency explanation, which makes the math feel like common sense.
An Investigator's Perspective: The Odds Form
As an investigator with a background in Bayesian decision theory, you know that thinking in terms of probabilities can sometimes be cumbersome. A more elegant and often more intuitive approach is to think in terms of odds.
The relationship is simple:
Odds = Probability / (1 - Probability)Probability = Odds / (1 + Odds)
The beauty of this reframing is that it simplifies Bayes' theorem into a clean, multiplicative process:
Where:
- Prior Odds: The odds of compatibility before the test. This is derived from the prevalence.
- Bayes Factor (or Likelihood Ratio): A measure of the strength of the evidence. For a positive test, it's
Sensitivity / (1 - Specificity). It tells you how much more likely a positive result is in a compatible couple versus an incompatible one. - Posterior Odds: The updated odds of compatibility after seeing the positive test result.
This formulation cleanly separates your prior belief (the base rate) from the strength of the new evidence (the test's power). The following video explains this powerful formulation brilliantly.
The medical test paradox, and redesigning Bayes' rule
In "The medical test paradox," 3Blue1Brown redesigns Bayes' rule to be more intuitive and practical, which will resonate with your expertise.
First, watch the initial explanation of the paradox using a concrete sample and defining sensitivity and specificity. Then, jump to the section on updating your chances, which introduces the Bayes factor. The core of the new approach is explained in the segment on framing Bayes' rule with odds. Finally, the comparison of the two formulas highlights the advantages of the odds-based approach for an investigator like yourself.
Let's re-run our case with this method. Using the app's actual performance:
-
Prior Odds:
Prevalence = 0.15 (Probability)
Prior Odds = 0.15 / (1 - 0.15) = 0.15 / 0.85 ≈ 0.176 (or about 1 to 5.7) -
Bayes Factor:
Sensitivity = 0.90; False Positive Rate (1 - Specificity) = 0.20
Bayes Factor = 0.90 / 0.20 = 4.5 -
Posterior Odds:
Posterior Odds = 0.176 * 4.5 ≈ 0.792 (or about 1 to 1.26) -
Convert to Probability (PPV):
PPV = 0.792 / (1 + 0.792) ≈ 0.442
The result is identical (44.2%), but the process cleanly separates the weak starting point (low prior odds) from the mediocre evidence provided by the test (a Bayes Factor of only 4.5).
Conclusion: The Evidence Mounts
Today, we've moved from observation to explanation. By applying Bayes' theorem, we have not only confirmed our earlier findings but have also built a formal, mathematical case that explains why the ErosEncore app is failing its users. The low base rate of genuine compatibility acts as a powerful anchor, dragging down the predictive value of even a theoretically accurate test.
Key Takeaways:
- Bayes' theorem provides the formal link between a test's intrinsic properties (sensitivity, specificity) and its practical predictive value (PPV), with prevalence as the critical connecting variable.
- The "Bayesian trap" or base rate fallacy explains why a test with high stated accuracy can have a very low PPV when the condition it's testing for is rare.
- ErosEncore's marketing is doubly deceptive: it overstates its accuracy, and it ignores the powerful, negative effect of the low compatibility base rate on its recommendations.
- Framing Bayesian updates in terms of odds and the Bayes Factor offers an elegant and powerful way to separate prior beliefs from the strength of new evidence.
We have now established that the low base rate is the key factor. But how sensitive is the app's reliability to this rate? In our next session, we will conduct a simulation. By varying the base rate of compatibility from very low to very high, we will generate a complete profile of the app's performance. This will allow us to pinpoint the exact conditions under which the app could be considered reliable and will provide a powerful visual exhibit for our final case file.
