Welcome back, Detective. With the ErosEncore case now closed and filed away, a new, perplexing dossier has landed on your desk. This one concerns two of the city's most exclusive and fiercely competitive boudoir photography studios: "Satin & Shadow" and "Velvet & Vellum."
Each studio has launched a marketing blitz, and curiously, both are brandishing data that appears to prove they have a higher client satisfaction rate than their rival. Logic dictates that both cannot be superior simultaneously. This isn't just a marketing squabble; it's a statistical impossibility, or so it seems.
Your new assignment is to untangle this "Studio Paradox." Is one of the studios fabricating their numbers, or are we facing a more subtle statistical illusion? To solve this mystery, you will need to dissect their satisfaction data, computing both the overall (marginal) satisfaction rates and the rates within specific client groups (stratum-specific). By doing so, you'll uncover how both studios can, in a way, be telling the truth, and you'll identify the powerful statistical phenomenon at the heart of this puzzle.
A Glimpse into the Paradox
Before we examine the case file, let's warm up with a classic demonstration of how this kind of statistical reversal can occur. A trend that appears in individual groups of data can sometimes reverse when those groups are combined. This is a notorious trap for the unwary analyst.
The resource below from Brilliant.org provides a wonderfully clear introduction to this idea, using a simple competition as an example. It will attune you to the kind of logical twist we're about to confront.
Simpson's Paradox | Brilliant Math & Science Wiki
This article introduces the paradox with a relatable story and then provides a formal mathematical definition. It's the perfect primer for our case.
First, read the introductory section, starting from the problem-solving competition. Then, review the formal definition that follows. Pay close attention to how the inequality sign flips when moving from the individual groups (i) to the sum (\sum).
The Case of the Rival Studios
Now, let's open the case file. You have obtained the raw satisfaction data from both studios for their last several hundred clients. The metric is simple: was the client "Highly Satisfied" (Yes/No) with their experience?
First, let's look at the top-line numbers—the kind of figures a marketing department loves to use.
Marginal Association: The Overall Picture
Here is the aggregated data for both studios:
- Satin & Shadow (S&S): 400 total clients, 300 of whom were "Highly Satisfied."
- Velvet & Vellum (V&V): 300 total clients, 175 of whom were "Highly Satisfied."
Let's compute the overall, or marginal, satisfaction rates. This association looks at the relationship between the studio and satisfaction across the entire client population, ignoring any other factors.
For Satin & Shadow:
For Velvet & Vellum:
The conclusion seems obvious. Satin & Shadow has a significantly higher overall satisfaction rate. This data supports their claim of superiority. Case closed? Not so fast. The marketing materials from Velvet & Vellum are just as confident. How can that be?
Uncovering the "Lurking Variable"
As we saw in the ErosEncore case, aggregated data can often hide a crucial piece of the puzzle. This phenomenon is sometimes called a "lurking variable." The short video below illustrates a classic example in a hospital setting, which mirrors our current situation perfectly.
How statistics can be misleading - Mark Liddell
This TED-Ed video, "How statistics can be misleading," provides an excellent visual and narrative explanation of the paradox.
Watch the segment from the beginning, which compares two hospitals. Notice how the hospital that appears worse overall is actually better when patients are divided into two groups based on their health upon arrival.
Inspired by the video, you dig deeper into the case file and find an important note: both studios offer two distinct photoshoot packages.
- The "Signature" Package: A premium, high-end, all-day experience.
- The "Classic" Package: A standard, more affordable introductory session.
Could the choice of package be the lurking variable that resolves this paradox? We must now analyze the data again, but this time stratified by the package type.
Stratum-Specific Associations: The Deeper Truth
Here is the complete data, broken down into a 2x2x2 contingency table structure: Studio × Package × Satisfaction.
| Studio | Package | Highly Satisfied | Not Highly Satisfied | Total Clients | Satisfaction Rate |
|---|---|---|---|---|---|
| Satin & Shadow | Signature | 270 | 30 | 300 | 90% |
| Classic | 30 | 70 | 100 | 30% | |
| Velvet & Vellum | Signature | 95 | 5 | 100 | 95% |
| Classic | 80 | 120 | 200 | 40% |
Let's compute the stratum-specific associations—the satisfaction rates within each package type (or stratum).
1. For the "Signature" Package stratum:
- Satin & Shadow:
- Velvet & Vellum:
Within the group of clients who bought the premium Signature package, Velvet & Vellum has a higher satisfaction rate.
2. For the "Classic" Package stratum:
- Satin & Shadow:
- Velvet & Vellum:
Within the group of clients who bought the standard Classic package, Velvet & Vellum also has a higher satisfaction rate.
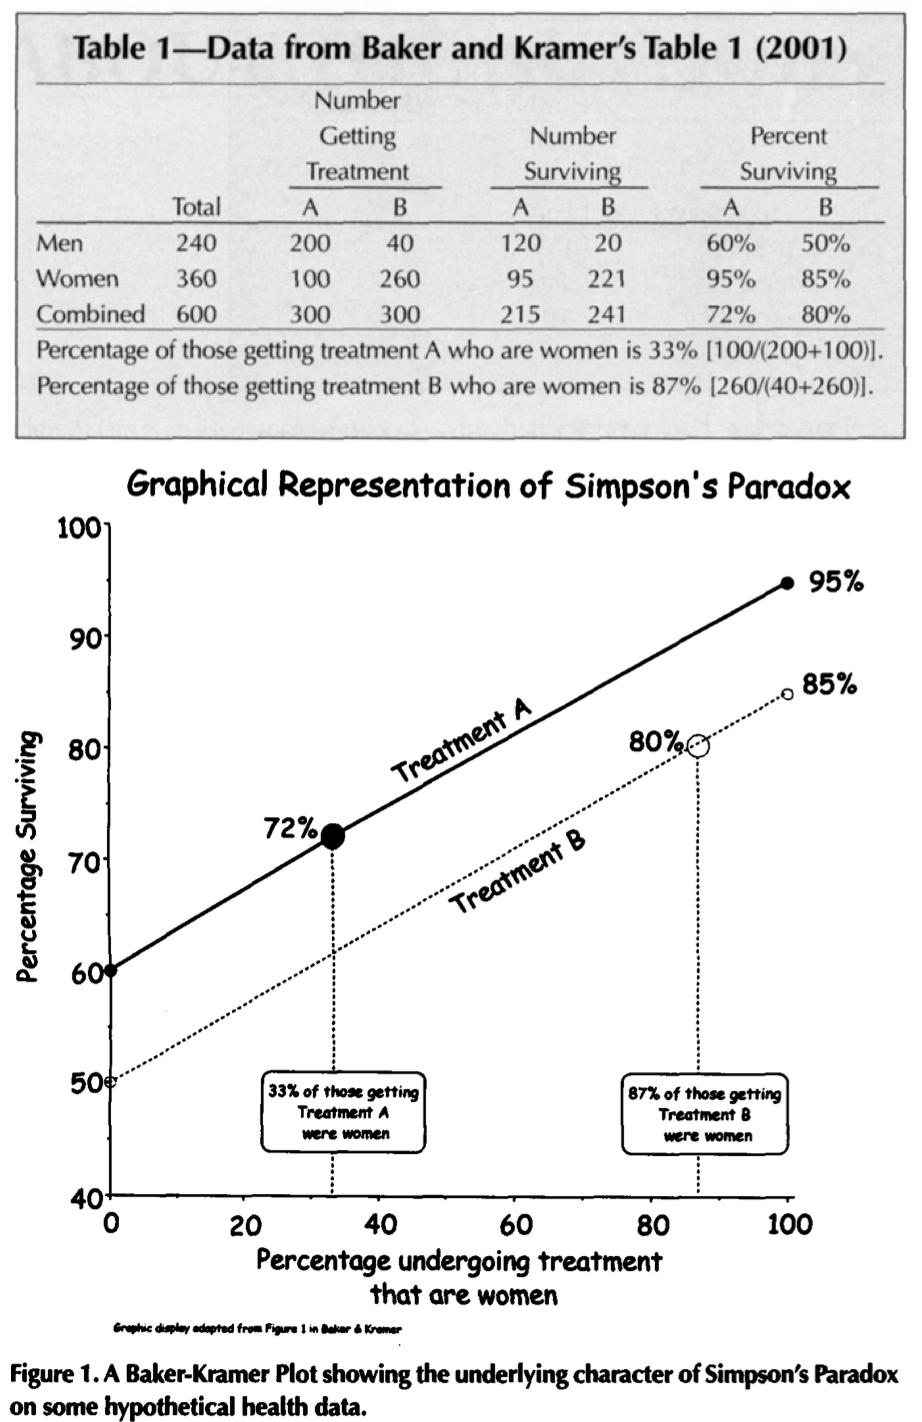
This is the heart of the paradox. Velvet & Vellum is the better-performing studio for clients of either package type. Yet, Satin & Shadow has the better overall satisfaction rate.
The Resolution: A Matter of Weighting
So, how is this possible? Given your background in experimental design, you'll recognize this as a classic confounding effect driven by non-random assignment. The "paradox" is a mathematical illusion caused by unequal group sizes.
Let's examine the client distribution:
- Satin & Shadow's business is dominated by the "Signature" package (300 out of 400 clients, or 75%). This package appears to have a very high base rate of satisfaction, regardless of the studio.
- Velvet & Vellum's business is primarily composed of "Classic" package clients (200 out of 300, or 67%). This package has a much lower base rate of satisfaction.
Satin & Shadow's high overall average is inflated because the bulk of their clients are from the "easy-to-satisfy" premium group. Conversely, Velvet & Vellum's overall average is dragged down by their large number of clients from the "harder-to-satisfy" standard group.
In essence, the aggregated data creates a misleading comparison because it's like comparing apples and oranges—or in this case, a studio that mostly serves premium clients with one that mostly serves standard clients. The stratum-specific rates provide the more meaningful, apples-to-apples comparison.
Conclusion: The Paradox Unraveled
The mystery is solved. Neither studio was lying; they were simply presenting the data that best supported their claims.
- Satin & Shadow correctly claims a higher overall (marginal) satisfaction rate of 75% vs. V&V's 58.3%.
- Velvet & Vellum correctly claims a higher group-specific (stratum-specific) satisfaction rate, outperforming S&S within both the Signature (95% vs. 90%) and Classic (40% vs. 30%) package types.
This reversal is a classic case of Simpson's Paradox.
Key Takeaways:
- A statistical association observed in an aggregated population (marginal association) can be reversed within the individual subgroups that make up that population (stratum-specific associations).
- This reversal is often caused by a "lurking" or confounding variable (here, Package Type) that is unequally distributed among the groups being compared.
- Computing stratum-specific associations is a critical step in any analysis to ensure that an overall trend is not a statistical illusion created by aggregation.
Preview of the Next Investigation: The Collider Collision
We've established that the stratum-specific rates give a more honest comparison of the studios' performance. But this raises a new question for our investigation. This paradox arose because the package a client chose was related to both the studio they went to and their ultimate satisfaction.
In our next session, we will explore another, stranger type of paradox that can occur not when we fail to stratify, but when we improperly stratify on a specific kind of variable known as a "collider." This will lead us into the treacherous territory of Berkson's Paradox, a counter-intuitive phenomenon that can create spurious associations out of thin air.