Greetings, Detective.
Our investigation into the "Midnight Seraph" heist has sent ripples through the underground luxury community. We've successfully quantified the local theft, but our intelligence suggests this is merely a single thread in a much larger web. The mastermind we're hunting operates across multiple platforms—exclusive forums, review sites, even the boutique’s own loyalty program—leaving a complex digital trail. We've compiled a massive dataset on dozens of persons of interest, tracking everything from their posting frequency and sentiment to their purchase histories. The raw data is a chaotic flood of numbers, a testament to the mastermind's sophisticated, multi-faceted operation. Trying to spot a pattern in this mess is like trying to hear a whisper in a hurricane.
This brings us to the central problem of our final case, "The Mastermind's Gambit." Our adversary hides in plain sight, concealed not by a lack of evidence, but by an overwhelming abundance of it. We have too many variables, too many dimensions of behavior to analyze meaningfully. To unmask the mastermind, we must first find a way to silence the noise and amplify the signal, distilling dozens of behavioral traits into a handful of core patterns. Today, we will learn a technique to do just that—to cut through the complexity and find the underlying structure of our suspects' activities.
The Problem of Too Much Information: The Curse of Dimensionality
In our line of work, you'd think more information is always better. However, when building a profile or a predictive model, adding more and more features (or "dimensions") can paradoxically make things worse. Past a certain point, new features add more noise than signal, confusing our analysis and hiding the very patterns we seek. This phenomenon is known as the curse of dimensionality.
Imagine trying to profile a suspect. You start with key variables: age, location, income. Your profile is clear. Then you add shoe size, favorite color, preferred coffee shop, number of social media posts per day, average review length... soon you have hundreds of variables. Instead of a sharp profile, you have a blurry mess. Your model, or your own expert judgment, gets bogged down in irrelevant details.
To get a more formal intuition for this, we'll turn to a short video explanation.
PCA Indepth Geometric And Mathematical InDepth Intuition ML Algorithms
In this video, "PCA Indepth Geometric And Mathematical InDepth Intuition," data science educator Krish Naik explains the curse of dimensionality.
Watch the first part of the video, from the beginning to the explanation of the problem. Pay close attention to the example of model accuracy decreasing as more features are added. This is the core challenge we face with our suspect dataset.
As the video explains, we have two main ways to combat this:
- Feature Selection: We could try to pick the "most important" variables and discard the rest. This is risky, as we might throw away features that seem unimportant alone but are crucial in combination.
- Feature Extraction: We can create a smaller set of new, synthetic features from the old ones, with the goal of retaining as much of the original information as possible.
It is this second approach, feature extraction, that we will employ today. We don't want to throw away data; we want to transform it into a more manageable and insightful form.
A New Perspective: Principal Component Analysis (PCA)
The tool for this job is Principal Component Analysis (PCA). PCA is not a data reduction technique in itself, but a data transformation technique. It doesn't discard variables; it reframes the entire dataset, creating a new coordinate system based on the patterns within the data itself.
Data Analysis 6: Principal Component Analysis (PCA) - Computerphile
This video from the Computerphile channel, "Data Analysis 6: Principal Component Analysis (PCA)," gives a superb high-level overview of this idea.
Watch the introductory segment from the explanation. The key idea is that PCA provides a "different view for our data in which we can separate it better."
PCA constructs new variables, called principal components (PCs), which are weighted sums of the original variables. The magic of PCA is how it constructs them:
- The first principal component (PC1) is oriented in the direction of the largest possible variance in the data. It is the single most informative summary of the data.
- The second principal component (PC2) is orthogonal (at a right angle) to the first and captures the next largest amount of variance.
- This continues for as many dimensions as you started with, with each successive component capturing less and less of the remaining variance.
By transforming our data onto these new axes, we concentrate the most important information into the first few components, allowing us to see the primary patterns of activity.
The Geometry of Insight
Let's visualize this. Imagine our behavioral data has only two features, say review_frequency (X-axis) and purchase_frequency (Y-axis). The data points might form an elongated cloud. Neither axis alone tells the full story.
PCA finds the line that passes through the center of this cloud and best captures its spread. This line is our first principal component (PC1). The line perpendicular to it is the second (PC2).
By rotating our view to align with these new axes, the underlying structure of the data becomes clear.
PCA Indepth Geometric And Mathematical InDepth Intuition ML Algorithms
Krish Naik's video provides an excellent geometric intuition of this process.
Watch the segment from the geometric intuition. It vividly illustrates how projecting data onto a naive axis (like the original X-axis) loses information, while projecting onto a principal component preserves the maximum variance.
The Engine Room: Eigen-decomposition of the Covariance Matrix
Given your background in statistics, we can look under the hood at the mechanism that finds these principal components. The process relies on concepts you're familiar with: standardization, covariance matrices, and eigen-decomposition.
-
Standardize the Data: Before PCA, we must standardize each variable to have a mean of 0 and a standard deviation of 1. This is crucial because PCA is sensitive to the scales of the original variables. A variable with a large range (e.g.,
time_spent_on_forumsin seconds) would dominate the analysis over a variable with a small range (e.g.,average_review_scorefrom 1-5), regardless of its actual importance. Standardization puts all variables on equal footing. -
Compute the Covariance Matrix: Next, we compute the covariance matrix for our standardized data. This matrix (where is the number of features) summarizes the variance of each feature and the covariance between each pair of features.
-
Calculate Eigenvectors and Eigenvalues: Here is the core of PCA. The principal components are the eigenvectors of the covariance matrix, and the variance explained by each principal component is its corresponding eigenvalue.
- The eigenvector with the largest eigenvalue is the first principal component (PC1). It points in the direction of maximum variance.
- The eigenvector with the second-largest eigenvalue is the second principal component (PC2), and so on.
This mathematical property is what allows PCA to systematically find the new axes that capture the most information.
PCA Indepth Geometric And Mathematical InDepth Intuition ML Algorithms
The next part of Krish Naik's video connects the covariance matrix to eigenvectors and eigenvalues.
Watch the segment explaining the role of eigenvectors. The key takeaway is that eigen-decomposition of the covariance matrix mathematically guarantees that we find the directions of maximum variance.
A scientific paper on applying PCA to robotic assessment data provides a concise summary of the standard procedure, confirming these steps.
This paper applies PCA to a high-dimensional dataset of human movement. While the domain is different, the methodology is universal and provides a good example of PCA in a formal research context.
Please read the "Principal Component Analysis" subsection within the "Methods" section. Pay attention to the sequence: the description of the process. They mention standardizing the data (Z-scores), using scree plots and parallel analysis to decide how many components to keep, and using rotation to improve interpretability.
Interpreting the Clues: Explained Variance and Loadings
After running PCA, we are left with a new set of principal components. To use them in our investigation, we need to interpret two key outputs.
1. Explained Variance and the Scree Plot
The eigenvalue of each PC, when divided by the sum of all eigenvalues, gives us the proportion of variance explained by that component. We can plot these values in a scree plot, which helps us decide how many components are needed to capture most of the information in the data. A common practice is to keep enough components to explain 90%, 95%, or even 99% of the total variance.
Understand your data with principal component analysis (PCA) and ...
This article from Towards Data Science gives a practical guide to interpreting PCA results.
First, read the section on explained variance. Then, review the next section on the scree plot, which visualizes this information. This will show you how to determine the "dimensionality" of your data and decide on a cutoff point.
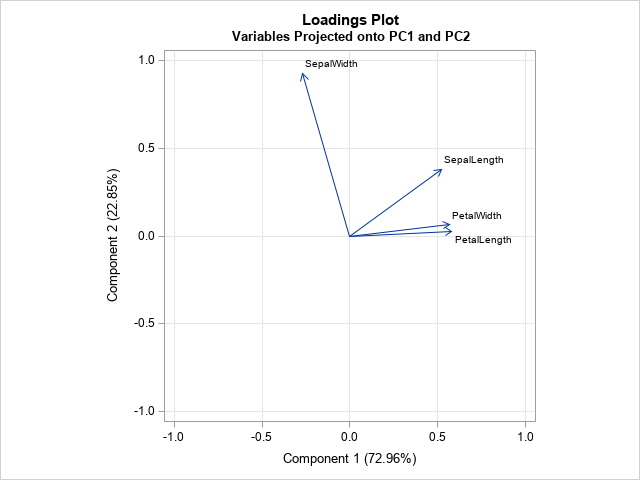
2. Component Loadings
To understand what each principal component represents, we examine its loadings. The loadings are the correlation coefficients between the original variables and the principal component. A variable with a high loading (close to +1 or -1) on a PC contributes strongly to it. By looking at which variables load highly onto a component, we can assign it a meaningful, interpretable label. This is how we isolate the significant patterns of activity.
Understand your data with principal component analysis (PCA) and ...
This final section of the same article explains how to use a loading matrix (often visualized as a heatmap) to interpret the meaning of each component.
Read the section titled "Discover underlying factors." Note how the author interprets the first component as "cognitive skills" based on which original variables had high correlations with it. This is exactly what we will do with our behavioral data.
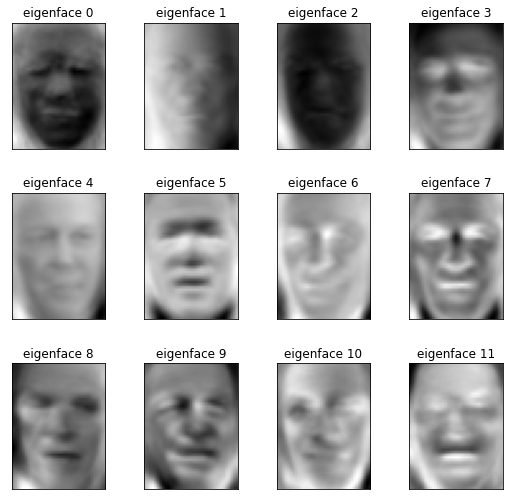
A classic, striking example of PCA's power is its application to image analysis, resulting in "eigenfaces".
Back to the Case
Now, let's apply this to our mastermind investigation. We have dozens of behavioral variables. After running PCA, we might find that the first three components explain 90% of the variance. We can then focus our analysis on just these three components.
By examining the loadings, we could find:
- PC1 (The "Agitator"): High positive loadings for
forum_post_frequency,negative_review_count, and high negative loading foraverage_purchase_value. - PC2 (The "Influencer"): High positive loadings for
social_media_follower_count,loyalty_program_points, andboutique_visit_frequency. - PC3 (The "Shadow Broker"): High positive loadings for
use_of_anonymizing_proxies,transaction_amount_variability, and high negative loading foraccount_age.
Instead of juggling 30+ variables, we now have three intuitive behavioral archetypes. We can score each of our suspects on these three components and plot them in this new 3D space. The mastermind will no longer be lost in the noise; their unique behavioral signature will stand out.
Conclusion
You've now been equipped with a powerful technique for navigating high-dimensional data. PCA allows us to cut through overwhelming complexity and find the underlying structure. By transforming our data into a new space defined by principal components, we can reduce dimensionality while preserving the crucial information carried in the variance. Interpreting the explained variance tells us how much information each component holds, while the loadings tell us what that information is.
Key Takeaways:
- High-dimensional data can suffer from the curse of dimensionality, where excess features obscure patterns and degrade model performance.
- Principal Component Analysis (PCA) is a feature extraction technique that transforms data onto a new coordinate system of principal components.
- Each successive PC captures the maximum possible remaining variance and is orthogonal to the previous ones.
- The process involves standardizing data, computing the covariance matrix, and finding its eigenvectors (the PCs) and eigenvalues (the variance explained).
- We use a scree plot of explained variance to decide how many components to retain for our analysis.
- We interpret the meaning of each PC by examining the loadings, which are the correlations between the original variables and the new component.
Preview of the Next Lesson
We have successfully transformed our noisy, complex behavioral data into a simplified, interpretable map defined by a few key patterns of activity. Our suspects are no longer just rows in a sprawling spreadsheet; they are points in a new "behavioral space". In our next session, we will use this map to hunt for our mastermind. We will apply clustering algorithms to this reduced data to segment our suspects into distinct groups, allowing us to isolate the most suspicious cluster and narrow our search.