Hello! Welcome to your next lesson.
In our last session, we explored Support Vector Machines (SVMs), a powerful supervised learning algorithm for classification. The key was that we always had labeled data to train our model—we knew the correct "answer" for each data point.
Today, we take our first step into the world of unsupervised learning, where the data has no predefined labels. Our goal is not to predict a known outcome, but to discover hidden structures and patterns within the data itself. This lesson introduces one of the most fundamental unsupervised algorithms: K-Means Clustering.
Your learning outcome is to apply the k-means clustering algorithm for unsupervised learning tasks.
To achieve this, we will cover:
- The core intuition behind K-Means and its step-by-step iterative process.
- The crucial question of how to choose the right number of clusters, , using the "Elbow Method."
- The importance of feature scaling when working with distance-based algorithms.
- How to implement K-Means from start to finish using Python and
scikit-learn.
1. What is Clustering and How Does K-Means Work?
Clustering is the task of grouping a set of objects in such a way that objects in the same group (called a cluster) are more similar to each other than to those in other groups. Imagine you have a dataset of customer information (like age and spending habits) without any labels. A clustering algorithm could help you automatically identify distinct customer segments, like "young high-spenders" or "older budget-shoppers."
K-Means is one of the most popular algorithms for this task. Its goal is to partition data into a pre-specified number of clusters, .
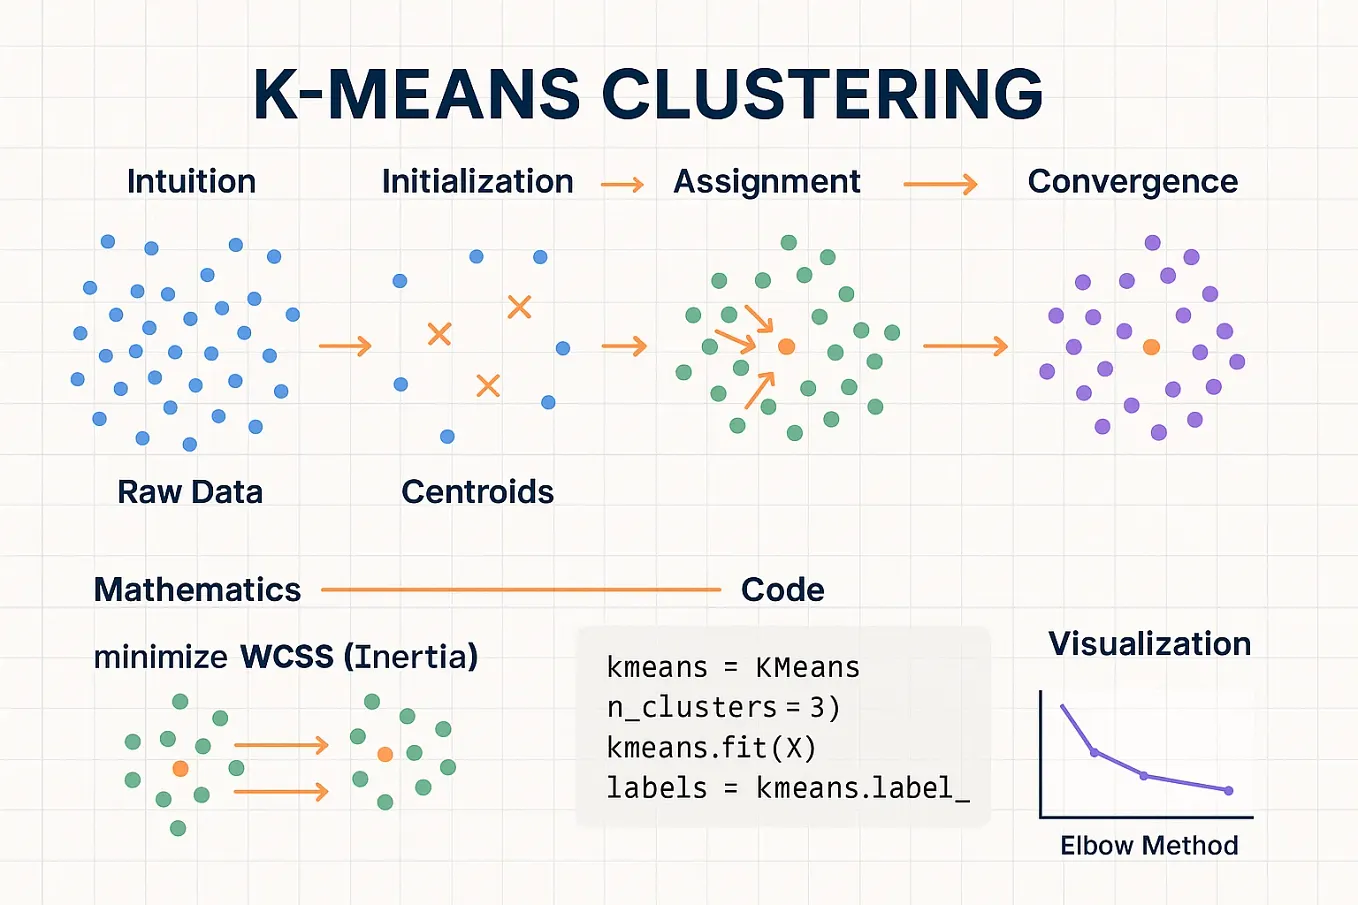
The K-Means Algorithm
The algorithm is surprisingly straightforward and works in an iterative fashion. It's often described as an "Expectation-Maximization" process.
Getting started with K-means clustering in Python
Let's review the steps of the K-Means algorithm. The following resource provides a clear, step-by-step recipe.
Read the section titled The K-means algorithm: A step-by-step recipe. This will give you a clear, 6-step summary of the process.
Here's a summary of those steps:
- Choose k: You decide how many clusters you want to find.
- Initialize Centroids: Randomly select data points from your dataset to act as the initial "centers" of your clusters. These are called centroids.
- Assign Points to Clusters: For every data point, calculate its distance to each of the centroids. Assign the data point to the cluster of the nearest centroid.
- Update Centroids: After assigning all points, recalculate the position of the centroids. The new centroid is the mean (average) of all data points assigned to that cluster.
- Repeat: Repeat the assignment (Step 3) and update (Step 4) steps until the centroids no longer move significantly. When this happens, the algorithm has converged, and you have your final clusters.
Watching this process unfold visually is the best way to build intuition. This StatQuest video does an excellent job of demonstrating the K-Means algorithm step by step.
Watch from the beginning to 04:23. Pay close attention to how the data points are assigned to clusters and how the centroids are re-calculated in each iteration.
2. How to Choose the Right Number of Clusters (K)?
The biggest challenge with K-Means is that you have to choose the value of yourself. How do you know if you should look for 3 clusters or 5? Choosing a good value for is a key part of the art and science of clustering.
The most common technique is the Elbow Method.
The core idea is to run the K-Means algorithm multiple times with a different number of clusters (e.g., ) and measure the "quality" of the clustering for each . For K-Means, a common quality metric is the Sum of Squared Errors (SSE), also known as inertia.
SSE (Inertia) is the sum of the squared distances between each data point and its assigned centroid.
A lower SSE means the points are, on average, closer to the center of their clusters, which is good. As you increase , the SSE will always decrease. If is equal to the number of data points, SSE will be 0, but that's not useful clustering.
We are looking for the point of diminishing returns—the "elbow" in the plot of SSE vs. .
Machine Learning Tutorial Python - 13: K Means Clustering Algorithm
Let's watch a brief explanation of the Elbow Method to understand how it works.
Watch from 04:47 to 07:34. This part of the video explains the concept of Sum of Squared Error (SSE) and how plotting it against different values of k helps you find the 'elbow' point.
The point where the SSE curve bends sharply, like an elbow, is a good candidate for the optimal number of clusters. Before this point, adding a new cluster significantly reduces the error. After this point, adding more clusters doesn't provide much benefit.
3. Implementing K-Means in Python
Now, let's put theory into practice. We'll use the scikit-learn library, which provides an efficient implementation of K-Means. We'll follow a practical example that also highlights a critical data preprocessing step: feature scaling.
Since K-Means relies on distance calculations, it's very sensitive to the scale of your features. If one feature (e.g., income in dollars) has a much larger range than another (e.g., age in years), the distance calculation will be dominated by the larger feature. To prevent this, we must scale our data first.
We will follow the codebasics video tutorial, breaking it down into a few parts.
Part A: A First Attempt (Without Scaling)
First, let's see what happens when we apply K-Means to unscaled data.
Machine Learning Tutorial Python - 13: K Means Clustering Algorithm
The following video segment demonstrates applying K-Means to a dataset of age and income. Pay close attention to the resulting clusters.
Watch from 07:34 to 13:52. The instructor loads the data, visualizes it, and applies K-Means. Notice that the resulting clusters don't look quite right.
As you saw, the clusters are not well-formed. The green and black clusters seem to be mixed incorrectly. This is a classic symptom of features being on different scales. The y-axis (income) has a range in the tens of thousands, while the x-axis (age) has a range of a few dozen. The algorithm is giving too much weight to income.
Part B: The Solution - Feature Scaling
To fix this, we'll use MinMaxScaler from scikit-learn to scale both features to a range between 0 and 1.
Machine Learning Tutorial Python - 13: K Means Clustering Algorithm
Now, let's see how to correctly preprocess the data before clustering.
Watch from 13:52 to 17:21. This part explains why scaling is needed and demonstrates how to use MinMaxScaler to transform the data.
Part C: K-Means on Scaled Data
With our data properly scaled, we can now run K-Means again and visualize the much-improved results, including the final centroid locations.
Machine Learning Tutorial Python - 13: K Means Clustering Algorithm
Let's apply K-Means to the scaled data and see the difference.
Watch from 17:21 to 20:54. Observe how the clusters are now correctly identified and how you can access the model's cluster centers (cluster_centers_).
The difference is night and day! The clusters are now clearly separated and make intuitive sense. This demonstrates that feature scaling is a crucial preprocessing step for K-Means.
Part D: Implementing the Elbow Method in Code
Finally, let's write the code to generate the elbow plot we discussed earlier to programmatically find the best value for .
Machine Learning Tutorial Python - 13: K Means Clustering Algorithm
The last step is to implement the elbow method to justify our choice of k=3.
Watch from 20:54 to 23:58. Follow along as the code iterates through different values of k, stores the SSE (retrieved from the .inertia_ attribute of the KMeans object), and plots the results to reveal the elbow.
The resulting plot clearly shows an "elbow" at , confirming that our choice was a good one for this dataset.
Test your understanding!
You are using the Elbow Method to find the optimal number of clusters for a new dataset. You generate the plot of SSE vs. , but the plot shows a smooth, almost straight line with no clear "elbow". What might this indicate about your data?
Show answer
A smooth curve with no clear elbow often indicates that the data does not have a strong, natural clustering structure that K-Means can easily detect. The data points might be uniformly distributed or form a single, large cloud rather than distinct, dense groups. In such cases, K-Means might not be the best algorithm for the task, or any choice of will be somewhat arbitrary. You might consider trying other clustering algorithms, like DBSCAN, which can handle non-globular clusters or identify noise.
Conclusion
Congratulations! You have just learned one of the most important algorithms in unsupervised machine learning. It's a powerful tool for discovering hidden groups in your data when you don't have the benefit of labels.
Key Takeaways:
- K-Means is an unsupervised algorithm that partitions data into distinct clusters.
- It works through an iterative process of assigning data points to the nearest centroid and then updating the centroid's position.
- The Elbow Method is a common technique for choosing the optimal number of clusters, , by plotting the Sum of Squared Errors (SSE or inertia) for a range of values.
- Feature scaling is essential for K-Means, as it is a distance-based algorithm. Features on different scales can lead to poor clustering results.
- In
scikit-learn, you usesklearn.cluster.KMeans, and you can find the SSE value in the.inertia_attribute after fitting the model.
Preview of the Next Lesson:
In our practical example, we worked with data that had only two features (age and income), which was easy to visualize. But what happens when you have hundreds or even thousands of features, as is common in data science? This is known as the "curse of dimensionality." In the next lesson, we will tackle this problem by learning about Principal Component Analysis (PCA), a powerful technique for dimensionality reduction.