Hello! Welcome to your next lesson on machine learning.
In our last session on K-Means, we explored our first unsupervised learning algorithm, discovering hidden clusters in data. We noted that the example dataset only had two features (age and income), which was easy to visualize. However, many real-world datasets have hundreds or even thousands of features. This "curse of dimensionality" can make it difficult to visualize data and can even hurt the performance of some machine learning models.
Today, we'll tackle this problem head-on. Your learning outcome is to apply Principal Component Analysis (PCA) for dimensionality reduction.
PCA is a powerful unsupervised learning technique that allows us to reduce the number of features (dimensions) in a dataset while retaining as much of the original information as possible.
In this lesson, you will learn:
- The core intuition behind PCA: finding new axes that best represent the data's variance.
- The step-by-step process of how PCA works, connecting it to concepts from linear algebra you've already seen.
- How to decide how many dimensions to keep using the "explained variance."
- How to implement PCA using Python and
scikit-learn.
1. The Intuition Behind PCA
Imagine you have a dataset with many features. PCA's goal is to create a new, smaller set of features that are combinations of the original ones. These new features, called principal components, are carefully constructed to be uncorrelated and to capture the maximum possible information, or variance, from the original data.
Let's start by building a strong visual intuition for this process.
StatQuest: Principal Component Analysis (PCA), Step-by-Step
This video from StatQuest provides an excellent, non-mathematical introduction to what PCA is trying to accomplish. It shows why we need it and what the principal components represent visually.
Watch from the beginning (00:23) to 05:54. Focus on understanding the problem of visualizing high-dimensional data and the idea of fitting a line that captures the most variation in the data.
As the video explains, PCA finds the directions in your data where the points are most spread out.
- The first principal component (PC1) is the direction (or axis) that captures the largest amount of variance.
- The second principal component (PC2) is the next direction that captures the most remaining variance, with the condition that it must be orthogonal (perpendicular) to PC1.
- This continues for all dimensions.
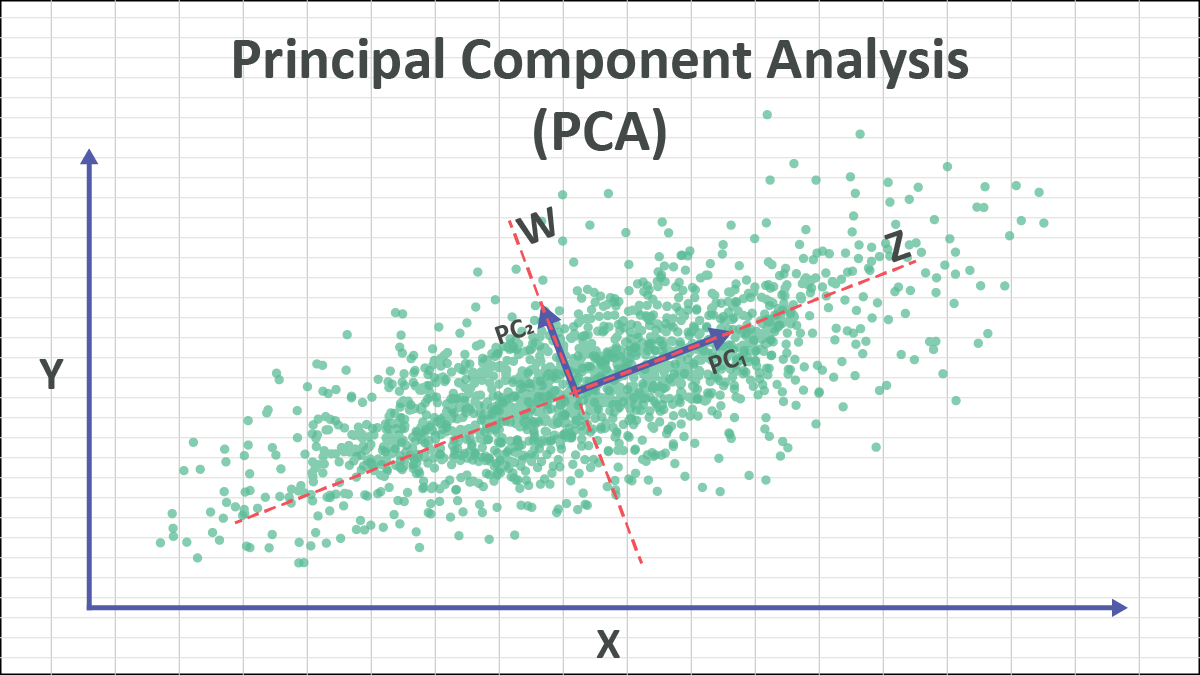
By transforming the data onto this new coordinate system, we can often discard the later principal components (which capture very little variance) and represent our data in a lower-dimensional space with minimal information loss.
2. How PCA Works: The Step-by-Step Process
Now that we have the intuition, let's walk through the steps involved. We'll combine a high-level conceptual guide with a look at the underlying mathematics. You've already covered the necessary linear algebra concepts like covariance, eigenvectors, and eigenvalues, so you'll see how they are practically applied here.
We can break down PCA into five main steps.
Principal Component Analysis (PCA): Explained Step-by-Step
This article provides a very clear, five-step breakdown of the PCA process. We'll use this as our roadmap.
Read the section titled How Principal Component Analysis Works: 5 Steps. This will give you a clear overview of the entire process from start to finish. We will dive deeper into each step next.
Here is a summary of those five steps, with some added detail:
-
Standardize the Data: Just like with K-Means, PCA is sensitive to the scale of the original variables. If one feature has a much larger range than others, it will dominate the analysis. Therefore, we must first standardize our data (e.g., by transforming it to have a mean of 0 and a standard deviation of 1). The StatQuest video referred to this as "centering" the data.
-
Compute the Covariance Matrix: The covariance matrix tells us how every variable in our dataset relates to every other variable. The diagonal elements are the variances of each variable, and the off-diagonal elements are the covariances between pairs of variables. This matrix is fundamental because it quantifies the "spread" of our data.
-
Compute Eigenvectors and Eigenvalues: This is the core mathematical step of PCA. We perform an eigen decomposition of the covariance matrix.
- The eigenvectors of the covariance matrix point in the directions of maximum variance. These are our principal components!
- The eigenvalues tell us the amount of variance captured by each corresponding eigenvector (i.e., each principal component).
-
Create a Feature Vector (Select Principal Components): We sort the eigenvalues in descending order. The eigenvector with the highest eigenvalue is the first principal component (PC1), as it captures the most variance. We then decide how many principal components we want to keep. For dimensionality reduction, we would choose to keep the first eigenvectors, where is smaller than the original number of dimensions.
-
Project Data onto the New Axes: Finally, we use the feature vector (the matrix of the top eigenvectors we decided to keep) to transform our original standardized data into the new, lower-dimensional space. This new dataset consists of the principal component scores.
The Math in Action
To see how the covariance matrix and its eigenvectors/eigenvalues produce the principal components, let's look at a mathematical walkthrough.
PCA : the math - step-by-step with a simple example
This video walks through the math for a simple 2D example. It clearly connects the concepts of the covariance matrix, eigenvalues, and the final principal components.
Watch the following segments to connect the theory to the calculations: Overview of Steps (01:13 - 01:51): Notice how these steps match the article we just read. Covariance Matrix (03:05 - 05:23): See how the covariance matrix is calculated from centered data. Eigenvalues & Eigenvectors (05:23 - 09:53): Observe how eigenvalues are found from the covariance matrix and how eigenvectors represent the new axes. Don't worry about memorizing the exact calculations, but focus on the process. Variance Explained (11:48 - 13:30): This is a key part. Notice that the eigenvalues are exactly the variances of the new principal components, and that the new components are uncorrelated (covariance is 0).
The most important takeaway from this is that the eigenvalues of the covariance matrix are the variances of the principal components. This property is what allows us to quantify exactly how much information each principal component holds.
3. Applying PCA in Python
Theory is great, but let's see how to apply PCA for dimensionality reduction in code. We'll use scikit-learn, which makes this process very straightforward.
In Depth: Principal Component Analysis
The Python Data Science Handbook provides a concise, code-first example of using PCA. We'll walk through the key parts.
Read the sections Introducing Principal Component Analysis and PCA as dimensionality reduction. Pay attention to how the PCA object is created and used with .fit(), .transform(), and .inverse_transform().
Let's summarize the workflow in scikit-learn:
import numpy as np
from sklearn.decomposition import PCA
from sklearn.preprocessing import StandardScaler

# Assume 'X' is your original data with shape (n_samples, n_features)
# For example, 150 samples and 10 features
X = np.random.rand(150, 10)

# 1. Standardize the data
scaler = StandardScaler()
X_scaled = scaler.fit_transform(X)

# 2. Initialize PCA
# Let's say we want to reduce to 2 dimensions
pca = PCA(n_components=2)

# 3. Fit and transform the data
X_pca = pca.fit_transform(X_scaled)

# Now X_pca is our new, lower-dimensional data
print("Original shape:", X_scaled.shape)
print("Transformed shape:", X_pca.shape)

# You can inspect the explained variance
print("Explained variance ratio:", pca.explained_variance_ratio_)
The explained_variance_ratio_ attribute shows the proportion of the dataset's variance that lies along each principal component. In our example, [0.15, 0.12] would mean PC1 accounts for 15% of the variance and PC2 accounts for 12%.
Choosing the Number of Components
So, how do we choose the right number of components, like n_components=2? We don't want to pick an arbitrary number. The goal is to keep enough components to preserve most of the data's information while still achieving a meaningful reduction in dimensionality.
We can do this by looking at the cumulative explained variance. We plot the total variance explained as we add more and more principal components. This plot is often called a scree plot.
In Depth: Principal Component Analysis
Let's return to the Python Data Science Handbook to see how to create and interpret this plot.
Read the section Choosing the number of components. The code shows how to fit PCA without specifying n_components first, and then plotting the cumulative sum of explained_variance_ratio_.
The typical goal is to choose a number of components that captures a high percentage of the total variance, often between 90% and 99%. The plot helps you see the trade-off. For example, you might find that you need 20 components to explain 95% of the variance in a 100-dimensional dataset. This would be a reduction from 100 features to just 20, which is a huge improvement!
Test your understanding!
You are working with a dataset that has 200 features. After running PCA, you create a cumulative explained variance plot. The plot shows that the first 3 components explain 35% of the variance, and you need to keep 150 components to explain 95% of the variance.
Is PCA an effective dimensionality reduction technique for this specific dataset? Why or why not?
Show answer
In this scenario, PCA is not very effective. The goal of dimensionality reduction is to significantly reduce the number of features while retaining most of the information. Here, you need to keep 150 out of 200 features to capture 95% of the variance. This is only a minor reduction (25%). This suggests that the information (variance) in this dataset is spread out quite evenly across many dimensions, and there isn't a small number of underlying "principal" components. The data doesn't have a strong low-dimensional structure that PCA can exploit.
Conclusion
Great work! You've just learned about one of the most widely used techniques in data science and machine learning. PCA is not only for visualization but is also a common preprocessing step to improve the speed and performance of other machine learning algorithms.
Key Takeaways:
- Principal Component Analysis (PCA) is an unsupervised learning method used for dimensionality reduction.
- It works by finding a new set of axes—principal components—that are orthogonal and aligned with the directions of maximum variance in the data.
- The process involves standardizing the data, computing the covariance matrix, and then finding its eigenvectors (the PCs) and eigenvalues (the variance explained by each PC).
- The effectiveness of PCA is measured by the cumulative explained variance, which helps you decide how many components to keep to preserve a desired amount of information (e.g., 95%).
scikit-learnprovides a simple and powerful implementation through thePCAclass.
Preview of the Next Lesson:
So far, we've learned to apply individual steps like feature scaling (in K-Means) and dimensionality reduction (with PCA) before training a model. In a real project, you might chain many such steps together. In the next lesson, we will learn how to build a complete modeling workflow using scikit-learn's Pipeline object. This will allow you to cleanly combine preprocessing steps and a final estimator into a single, elegant object.