Hello! Welcome to your next lesson in the "Advanced Machine Learning Models" module.
In our previous lesson, we explored ensemble methods like Random Forests and Gradient Boosting, where the strategy was to combine many simple models to create a single, powerful predictor. Today, we're going to explore a completely different, yet equally powerful, approach to classification: Support Vector Machines (SVMs).
Instead of building a "committee" of models, an SVM works by finding the single best decision boundary that separates our data. This lesson is designed to help you apply Support Vector Machines (SVM) for classification problems.
We will cover:
- The core intuition behind SVMs: finding the "widest possible street" between classes.
- Key concepts: the hyperplane, margin, and support vectors.
- How SVMs handle real-world, messy data using a "soft margin."
- The famous "kernel trick" that allows SVMs to solve complex, non-linear problems.
- How to implement and use SVMs in Python with
scikit-learn.
1. The Core Idea: The Maximal Margin Classifier
Imagine you have data points belonging to two different classes on a 2D plot. Your goal is to draw a line that separates them. As you might guess, there isn't just one line that can do the job; there could be infinitely many. So, which one is the best?
The core idea of an SVM is to choose the line that is as far as possible from the nearest data points of both classes. Think of it as drawing the widest possible "street" between the two groups of points. The line running down the middle of this street is our optimal decision boundary.
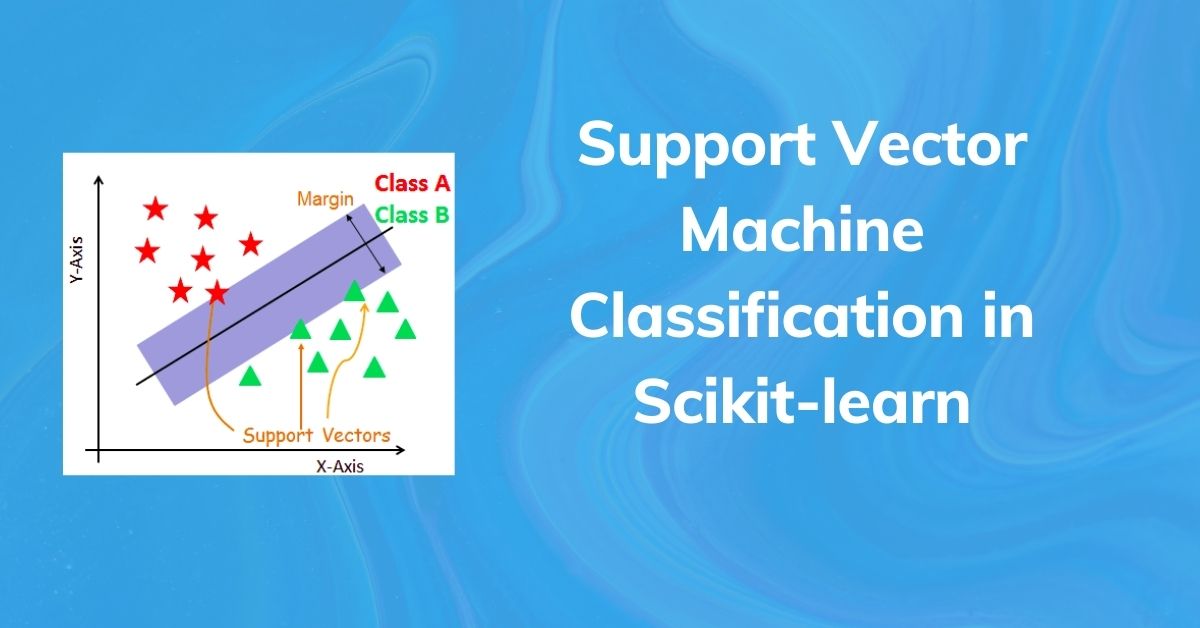
Let's formalize these terms:
- Hyperplane: This is the technical name for the decision boundary. In a 2D space, it's a line. In a 3D space, it's a flat plane. In spaces with more than three dimensions, we call it a hyperplane.
- Margin: This is the distance from the hyperplane to the closest points on either side. SVMs aim to maximize this margin. A wider margin suggests a more confident and robust model that is likely to generalize well to new data.
- Support Vectors: These are the data points that lie closest to the hyperplane, right on the edge of the margin. They are the most critical data points because they alone determine the position and orientation of the hyperplane. If you were to move any other point, the hyperplane wouldn't change. But if you move a support vector, the hyperplane will likely have to adjust.
Support Vector Machines Part 1 (of 3): Main Ideas!!!
To build a strong intuition for this, let's watch the first part of this excellent video from the StatQuest channel. It visualizes the process of finding the optimal threshold by maximizing the margin.
Watch from 00:36 to 03:39. Pay close attention to how the concept of the 'margin' is introduced and why a 'maximal margin classifier' is desirable.
This maximal margin approach seems great, but what happens if the data isn't perfectly separable? What if there are outliers?
2. Handling Imperfect Data: The Soft Margin Classifier
Real-world data is rarely perfect. Often, classes overlap, or there are outlier points that lie on the "wrong" side of where a clean boundary would be. A strict maximal margin classifier (also called a hard margin SVM) would fail in these situations or produce a very poor boundary.
To solve this, we use a soft margin SVM. This approach allows some data points to be misclassified or to fall inside the margin, but it adds a penalty for each of these violations. This creates a balance—a trade-off—between two goals:
- Keeping the margin as wide as possible.
- Minimizing the number of margin violations.
This is another example of the bias-variance tradeoff we've discussed before. A very strict model (high C) might have low bias but high variance (overfitting to the training data, including its noise). A more flexible model (low C) might have higher bias but lower variance (better generalization).
Support Vector Machines Part 1 (of 3): Main Ideas!!!
The StatQuest video continues by explaining exactly this problem. It shows how allowing for misclassifications can lead to a more robust and sensible classifier.
Now watch from 03:39 to 06:40. This part introduces the 'soft margin' and the idea of 'support vectors' as the points that are on the edge or within the margin.
The degree of this trade-off is controlled by a hyperparameter, typically denoted as C.
Support Vector Machine (SVM) classification model
Let's read a short section from a Medium article by Dilip Kumar that explains the C parameter and the soft margin formulation very clearly.
Read section 3.5 The Final Optimization Problem: Soft Margin SVM (The More Realistic Version). Focus on understanding the role of the slack variable (ξ) and the regularization parameter C.
In summary:
- A high
Cvalue puts a high penalty on misclassification. The SVM will try to classify as many examples correctly as possible, leading to a narrower margin and potentially overfitting. - A low
Cvalue puts a lower penalty on misclassification. The SVM will prioritize a wider margin, even if it means misclassifying a few training points. This often leads to better generalization.
3. Handling Non-Linear Data: The Kernel Trick
So far, we've only considered data that is more or less linearly separable. But what if our data looks like this, where no straight line could ever separate the classes effectively?
This image from GeeksForGeeks shows a dataset where the classes are arranged in concentric circles. A linear hyperplane cannot separate these classes.
This is where SVMs truly shine, thanks to a powerful mathematical idea called the kernel trick.
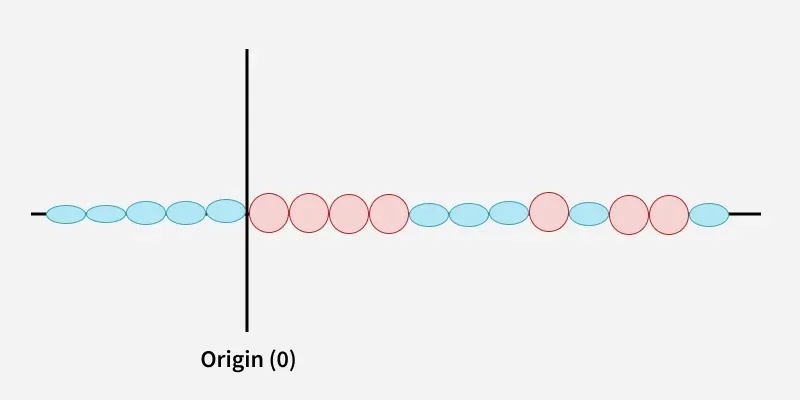
The core idea is this: if we can't separate the data in its current dimension, let's project it into a higher dimension where it does become linearly separable.
The "trick" is that we can do this without ever actually calculating the new coordinates of the points in the higher-dimensional space. Kernel functions allow us to compute the relationships between points as if they were in that higher space, which is computationally much cheaper.
Support Vector Machines Part 1 (of 3): Main Ideas!!!
The StatQuest video provides a fantastic, intuitive explanation of this concept. It shows how 1D, non-separable data can be transformed into 2D, separable data.
Watch from 11:10 to 17:40. Focus on the main idea: transforming data into a higher dimension to find a linear separator. The video will introduce two key kernel types: Polynomial and Radial (RBF).
Common SVM Kernels
You don't need to invent these transformation functions yourself. SVMs come with several standard kernels you can choose from. Let's look at the most common ones.
Support Vector Machine (SVM) classification model
This article provides a concise and practical summary of the main SVM kernels. Reading this will help you understand when to use each one.
Read the entire section 4 Types of SVM Kernels. Pay special attention to the Linear, Polynomial, and RBF kernels. For the RBF kernel, make sure you understand the role of the gamma hyperparameter.
Here's a quick summary of the key kernels and their hyperparameters:
- Linear Kernel: For linearly separable data. The main hyperparameter is
C. - Polynomial Kernel: For data with a curved boundary. Hyperparameters include
C,degreeof the polynomial, andgamma. - RBF (Radial Basis Function) Kernel: The most popular and flexible choice. It can create complex, non-linear boundaries. Its key hyperparameters are
Candgamma.gammadefines how much influence a single training example has. A lowgammameans a point has far-reaching influence (smoother boundary), while a highgammameans influence is very local (tighter, more complex boundary).
Test your understanding!
You are training an SVM with an RBF kernel. You notice that your model is performing perfectly on the training data but very poorly on the test data. Which two hyperparameters would you investigate and how might you adjust them to fix this problem?
Show answer
This is a classic case of overfitting. The model has learned the training data, including its noise, too well. The two hyperparameters to investigate are C and gamma.
- High
gamma: A highgammavalue makes the decision boundary very sensitive to individual data points, creating a complex, "wiggly" boundary that fits the training data perfectly. To reduce overfitting, you should try decreasinggammato make the boundary smoother and more general. - High
C: A highCvalue forces the model to classify every training point correctly, leading to a narrow margin and a complex boundary. To reduce overfitting, you should try decreasingCto allow for a wider margin and some misclassifications, which promotes better generalization.
4. Implementing SVM in Python with scikit-learn
Now for the practical part. Implementing an SVM in Python is straightforward using the scikit-learn library. The main class is SVC (Support Vector Classifier) from the sklearn.svm module.
The article we've been referencing has a great, simple code example that not only trains the model but also visualizes the result, including the hyperplane, margin, and support vectors.
Support Vector Machine (SVM) classification model
Let's walk through a practical coding example. This section will show you how to create, train, and visualize an SVM classifier.
Read and analyze the code in section 5.0 Python example. Pay attention to how the SVC class is instantiated with different kernels ('linear', 'rbf') and how the model is trained with model.fit(X, y). Notice how the resulting plots change based on the kernel used.
The key line of code is instantiating the classifier:model = SVC(kernel='rbf', C=1.0, gamma='auto')
Here, you can specify:
kernel: The kernel to use (e.g.,'linear','poly','rbf').C: The regularization parameter.gamma: The kernel coefficient for 'rbf' and 'poly'.
You would then train the model just like any other scikit-learn classifier: model.fit(X_train, y_train).
Conclusion
Great work! You've now learned about another cornerstone algorithm in machine learning. Unlike ensemble methods that combine many models, SVMs focus on finding a single, optimal separating boundary.
Key Takeaways:
- An SVM's goal is to find a hyperplane that creates the maximum margin between two classes.
- The data points that define this hyperplane are called support vectors.
- The soft margin approach, controlled by the
Chyperparameter, allows SVMs to handle noisy and overlapping data by trading off margin width against misclassification errors. - The kernel trick enables SVMs to solve complex, non-linear problems by implicitly mapping data to a higher-dimensional space. The RBF kernel, controlled by
gamma, is a powerful and popular default choice.
Preview of the Next Lesson:
So far in this course, all the machine learning we have done has been supervised learning—where we have labeled data (e.g., we know which tumor is benign or malignant). In our next lesson, we will venture into unsupervised learning, where the data has no labels. We will start with a fundamental clustering algorithm: k-means clustering, which is used to automatically discover groups in your data.