Hello! Welcome to the final lesson of your first module, "Python for Data Science: Foundations."
In our last lesson, you mastered the fundamentals of NumPy, learning how to create and operate on N-dimensional arrays. You saw how NumPy provides a fast and efficient foundation for numerical computing in Python.
Today, we build directly on that knowledge. We'll explore the Pandas library, which is arguably the most essential tool for practical, day-to-day data analysis in Python. Pandas is built on top of NumPy and provides a more powerful and flexible data structure for handling real-world, tabular data—the kind you'll find in spreadsheets, databases, and CSV files.
This lesson is designed to meet the learning outcome: Load, manipulate, and analyze data using the Pandas library's Series and DataFrame objects. By the end of this lesson, you will be able to take raw data from a file, bring it into a structured format, and start asking meaningful questions about it. This is a critical skill for your GATE preparation and your future career in data science.
1. The Core Components of Pandas: Series and DataFrame
Pandas introduces two primary data structures that you'll use constantly: the Series and the DataFrame.
- A
Seriesis a one-dimensional labeled array, much like a NumPy array but with an explicit index. You can think of it as a single column of data. - A
DataFrameis a two-dimensional labeled data structure, like a table in a spreadsheet or a SQL database. It has both a row index and column names.
The easiest way to think about their relationship is that a DataFrame is a collection of Series objects that share the same index.
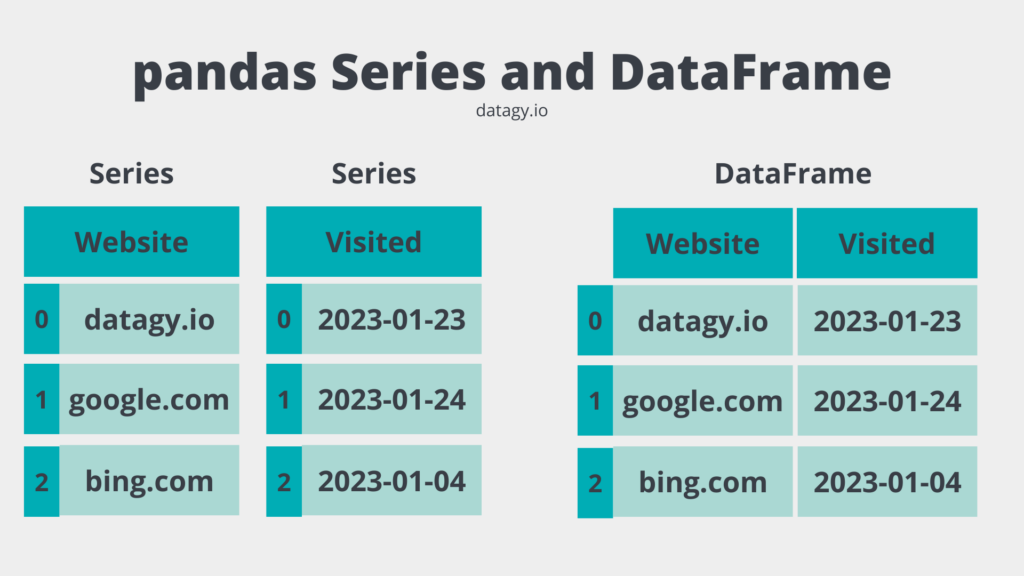
A DataFrame has a clear structure with an index for rows and names for columns.
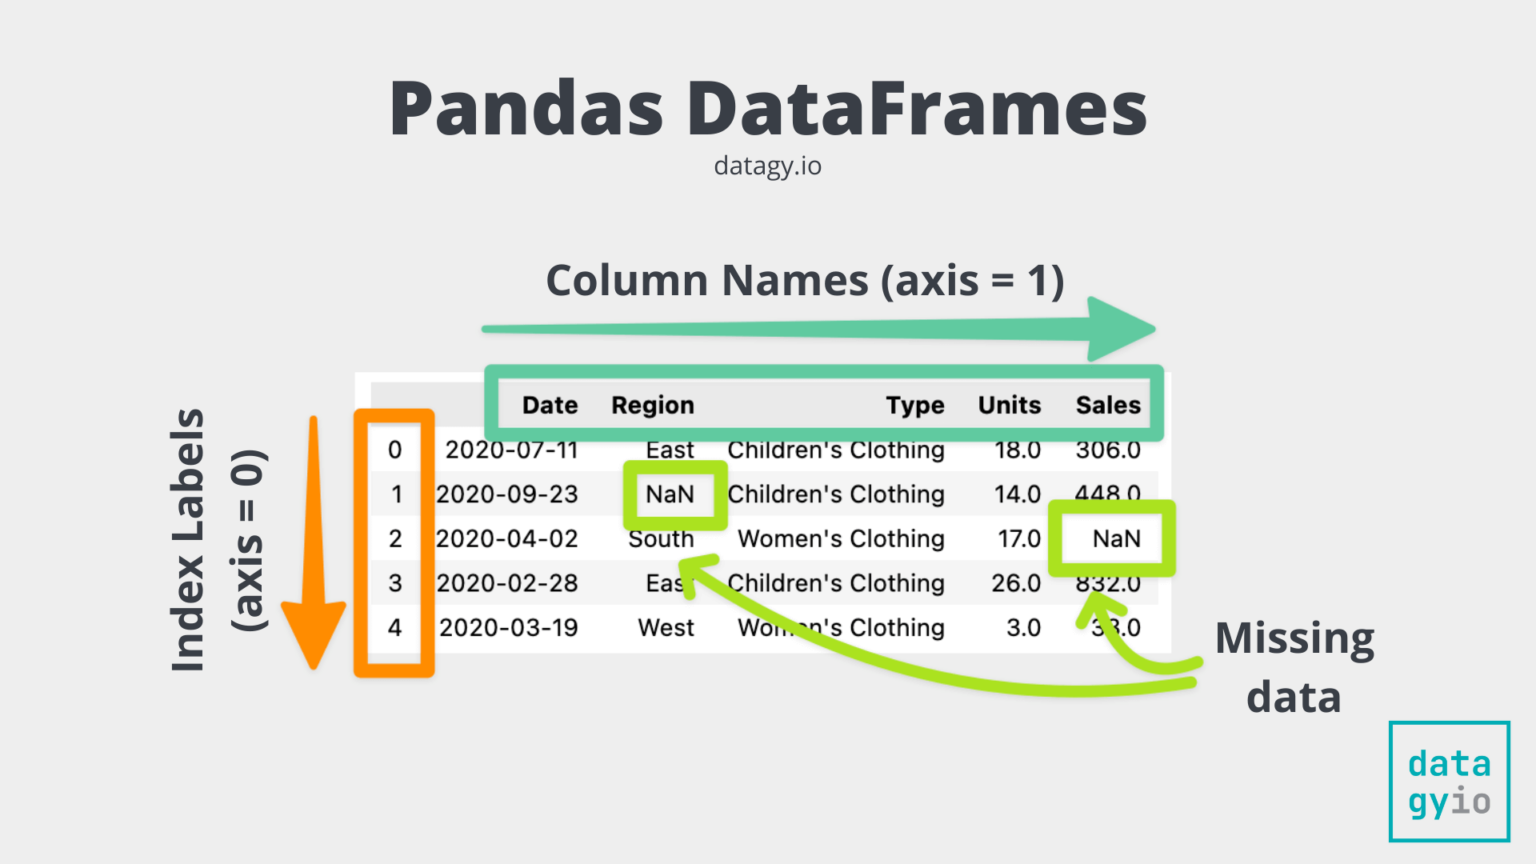
To see how these structures are created and how they relate to the Python dictionaries you already know, let's watch a short video.
Python Pandas Tutorial (Part 2): DataFrame and Series Basics - Selecting Rows and Columns
The 'Python Pandas Tutorial' by Corey Schafer provides a great conceptual start by showing how a DataFrame can be constructed from a simple Python dictionary.
Watch from the beginning to 08:12. Focus on how a DataFrame is analogous to a dictionary of lists, where dictionary keys become columns and the lists become the data in those columns.
As is standard practice, we'll import Pandas with the alias pd.
import pandas as pd
2. Loading Data into a DataFrame
While creating DataFrames from dictionaries is useful, in most data science tasks, you will load data from an external file. The most common format is a CSV (Comma-Separated Values) file.
Pandas makes this incredibly easy with the pd.read_csv() function. You simply provide the path to the file, and Pandas will parse it into a DataFrame.
Let's see how this works in practice. The following video will show you how to load a sample CSV file.
Learn Pandas in 30 Minutes - Python Pandas Tutorial
The 'Learn Pandas in 30 Minutes' video from Tech With Tim gets straight to the point, showing you how to load data from a CSV file.
Watch from 01:49 to 04:23. Observe the use of pd.read_csv() to create a DataFrame and how printing the DataFrame displays it as a neat table.
3. Inspecting and Understanding Your Data
Once you've loaded your data, the first step is always to inspect it to understand its structure and content. Pandas provides several essential methods for this initial exploration.
Let's assume we've loaded our data into a DataFrame called df (a common convention).
df.head(): Shows the first 5 rows. You can pass a number likedf.head(10)to see more.df.tail(): Shows the last 5 rows.df.shape: Returns a tuple(rows, columns), just like in NumPy.df.info(): Provides a concise summary, including the number of entries, the data type of each column, and the number of non-null values. This is extremely useful for spotting missing data.df.describe(): Generates descriptive statistics (count, mean, standard deviation, min, max, etc.) for all numerical columns.
The next video segment demonstrates these essential inspection methods.
Learn Pandas in 30 Minutes - Python Pandas Tutorial
Let's return to the video from Tech With Tim to see how these inspection methods are used on a newly loaded DataFrame.
Watch from 11:01 to 13:27. Pay attention to the output of each method (.head(), .info(), .describe()) and what it tells you about the dataset.
4. Manipulating Data: Selection and Filtering
This is where you'll spend a lot of your time as a data analyst—pulling out the specific pieces of data you need.
Selecting Columns
- To select a single column, use square brackets
[]with the column's name. This returns a PandasSeries.# Select the 'Product' column products = df['Product'] - To select multiple columns, use double square brackets
[[]]with a list of column names. This returns a newDataFrame.# Select the 'Product' and 'Price' columns product_details = df[['Product', 'Price']]
Selecting Rows and Columns with .loc and .iloc
Pandas provides two powerful indexers for more advanced selection:
.loc: Selects data by label. You use the index labels for rows and column names for columns..iloc: Selects data by integer position. You use integer indices for both rows and columns, just like in NumPy.
# Select the row with index label 3
df.loc[3]

# Select the row at integer position 3 (the 4th row)
df.iloc[3]

# Select rows with labels 3 through 5, and columns 'Product' to 'Price'
df.loc[3:5, 'Product':'Price']

# Select rows at positions 3 through 5, and columns at positions 2 through 4
df.iloc[3:6, 2:5] # Note: iloc is exclusive of the end position for slicing, like Python lists
Conditional Filtering
This is one of the most powerful features of Pandas. You can filter your DataFrame based on conditions, similar to a WHERE clause in SQL.
# Get all orders from the 'USA'
usa_orders = df[df['Country'] == 'USA']

# Get all orders where the quantity is greater than 2
high_quantity_orders = df[df['Quantity'] > 2]

# You can combine conditions using `&` (and) and `|` (or).
# IMPORTANT: Each condition must be wrapped in parentheses.
electronics_in_usa = df[(df['Category'] == 'Electronics') & (df['Country'] == 'USA')]
The following videos will give you a practical demonstration of these selection and filtering techniques.
Learn Pandas in 30 Minutes - Python Pandas Tutorial
First, let's see how to select columns and rows using .iloc.
Watch from 13:27 to 17:06. Notice the difference in output when you select one column (a Series) versus multiple columns (a DataFrame). Also, see how .iloc is used to grab specific rows.
Learn Pandas in 30 Minutes - Python Pandas Tutorial
Now, let's watch how to apply conditional filters to find specific data within the DataFrame.
Watch from 17:06 to 21:58. This is a crucial section. Pay close attention to the syntax for single conditions and how multiple conditions are combined with & and |.
Test your understanding!
Imagine you have a DataFrame sales_df with columns ['Product', 'Category', 'Price', 'Country'].
How would you write a single line of code to select the Product and Price for all sales that occurred in 'India' where the Price was over 500?
Show answer
The correct code would be:
sales_df.loc[(sales_df['Country'] == 'India') & (sales_df['Price'] > 500), ['Product', 'Price']]
Let's break it down:
(sales_df['Country'] == 'India') & (sales_df['Price'] > 500)creates the boolean mask for the rows we want to select.['Product', 'Price']is the list of columns we want to see.sales_df.loc[...]uses these two parts to select the precise slice of the DataFrame.
5. Basic Data Analysis and Aggregation
Once you can select and filter data, you can start analyzing it.
Value Counts
For categorical data, value_counts() is a quick way to see the distribution of items.
# Count the number of orders per country
df['Country'].value_counts()
GroupBy
The groupby() method is used for "split-apply-combine" operations. This is a powerful pattern in data analysis:
- Split the data into groups based on some criteria.
- Apply a function to each group independently.
- Combine the results into a data structure.
For example, to find the average price of products in each category:
# Group by category, then find the mean of the 'Price' column for each group
df.groupby('Category')['Price'].mean()
This next video segment demonstrates these powerful, one-line analysis methods.
Learn Pandas in 30 Minutes - Python Pandas Tutorial
The value_counts() and groupby() methods are fundamental to data analysis. Let's see them in action.
Watch from 27:49 to 29:09. Observe how value_counts() gives you a quick summary and how groupby() allows you to perform calculations on specific segments of your data.
Conclusion
Congratulations on completing the first module! You have built a solid foundation in Python, from basic syntax to the powerful data manipulation capabilities of NumPy and now Pandas. These are the tools you will rely on throughout your data science journey.
Key Takeaways:
- Pandas provides two main data structures: the 1D
Seriesand the 2DDataFrame. - Data is most commonly loaded from files using functions like
pd.read_csv(). - You should always start by inspecting your data with
.head(),.info(), and.describe(). - You can manipulate data by selecting columns with
[], and selecting specific rows and columns with.loc(label-based) and.iloc(position-based). - Conditional filtering (
df[df['column'] > value]) is essential for isolating data that meets specific criteria. - You can begin to analyze data using
.value_counts()for distributions and.groupby()for calculating statistics on subsets of your data.
This lesson marks the end of our "Python for Data Science: Foundations" module. You've acquired the essential programming skills needed to handle data. In the next module, "Mathematical Foundations: Linear Algebra," we will shift gears. You will learn the mathematical principles that power many of the advanced algorithms used in data science and machine learning. Your ability to work with data in NumPy and Pandas will be the perfect practical counterpart to the theoretical concepts you're about to explore.