Welcome back. In our previous lessons, we established the first two pillars of observability: structured logging, which gives us detailed event data, and metrics, which provide aggregated, numerical insights into system health. You've seen how to instrument a service to expose Prometheus metrics, giving you a high-level view of performance.
However, in a microservices architecture, a single user request can trigger a complex chain of calls across numerous services. When a request is slow or fails, logs from individual services are siloed, and aggregate metrics can hide the root cause. This lesson introduces the third and final pillar of observability that solves this very problem: distributed tracing.
Our goal is to understand the core concepts of distributed tracing, which allows us to follow the complete journey of a single request as it traverses multiple services. This provides the connective tissue that links together isolated logs and metrics, enabling us to pinpoint bottlenecks and debug failures in our distributed system with precision.
1. The Observability Gap: Why Logs and Metrics Aren't Enough
Imagine a user placing an order in our e-commerce system. This single action might involve the API Gateway, User Service, Order Service, and Inventory Service. If the user reports that the checkout process took 10 seconds, how would you investigate?
- Metrics might show that the average latency for the Inventory Service is 50ms, but this doesn't tell you if this specific request was an outlier that took seconds.
- Logs from each service would show that they handled a request, but correlating the log entries from four different services for that one user action is difficult, if not impossible, without a shared identifier.
You're left with critical unanswered questions: Which service caused the delay? Was the latency within a service or in the network communication between them? This is the visibility gap that distributed tracing is designed to fill.
The following video provides an excellent explanation of why traditional observability tools fall short in distributed systems and why a new approach is needed.
Distributed Tracing Explained: OpenTelemetry & Jaeger Tutorial
Watch this segment from the video "Distributed Tracing Explained: OpenTelemetry & Jaeger Tutorial" by DevOps & AI Toolkit. It effectively frames the problem that distributed tracing solves.
Focus on the explanation of why metrics and logs are insufficient for debugging intermittent issues in a microservices environment. Pay attention to how a single user request fans out into many independent calls and why this makes correlation difficult.
2. The Core Concepts of Distributed Tracing
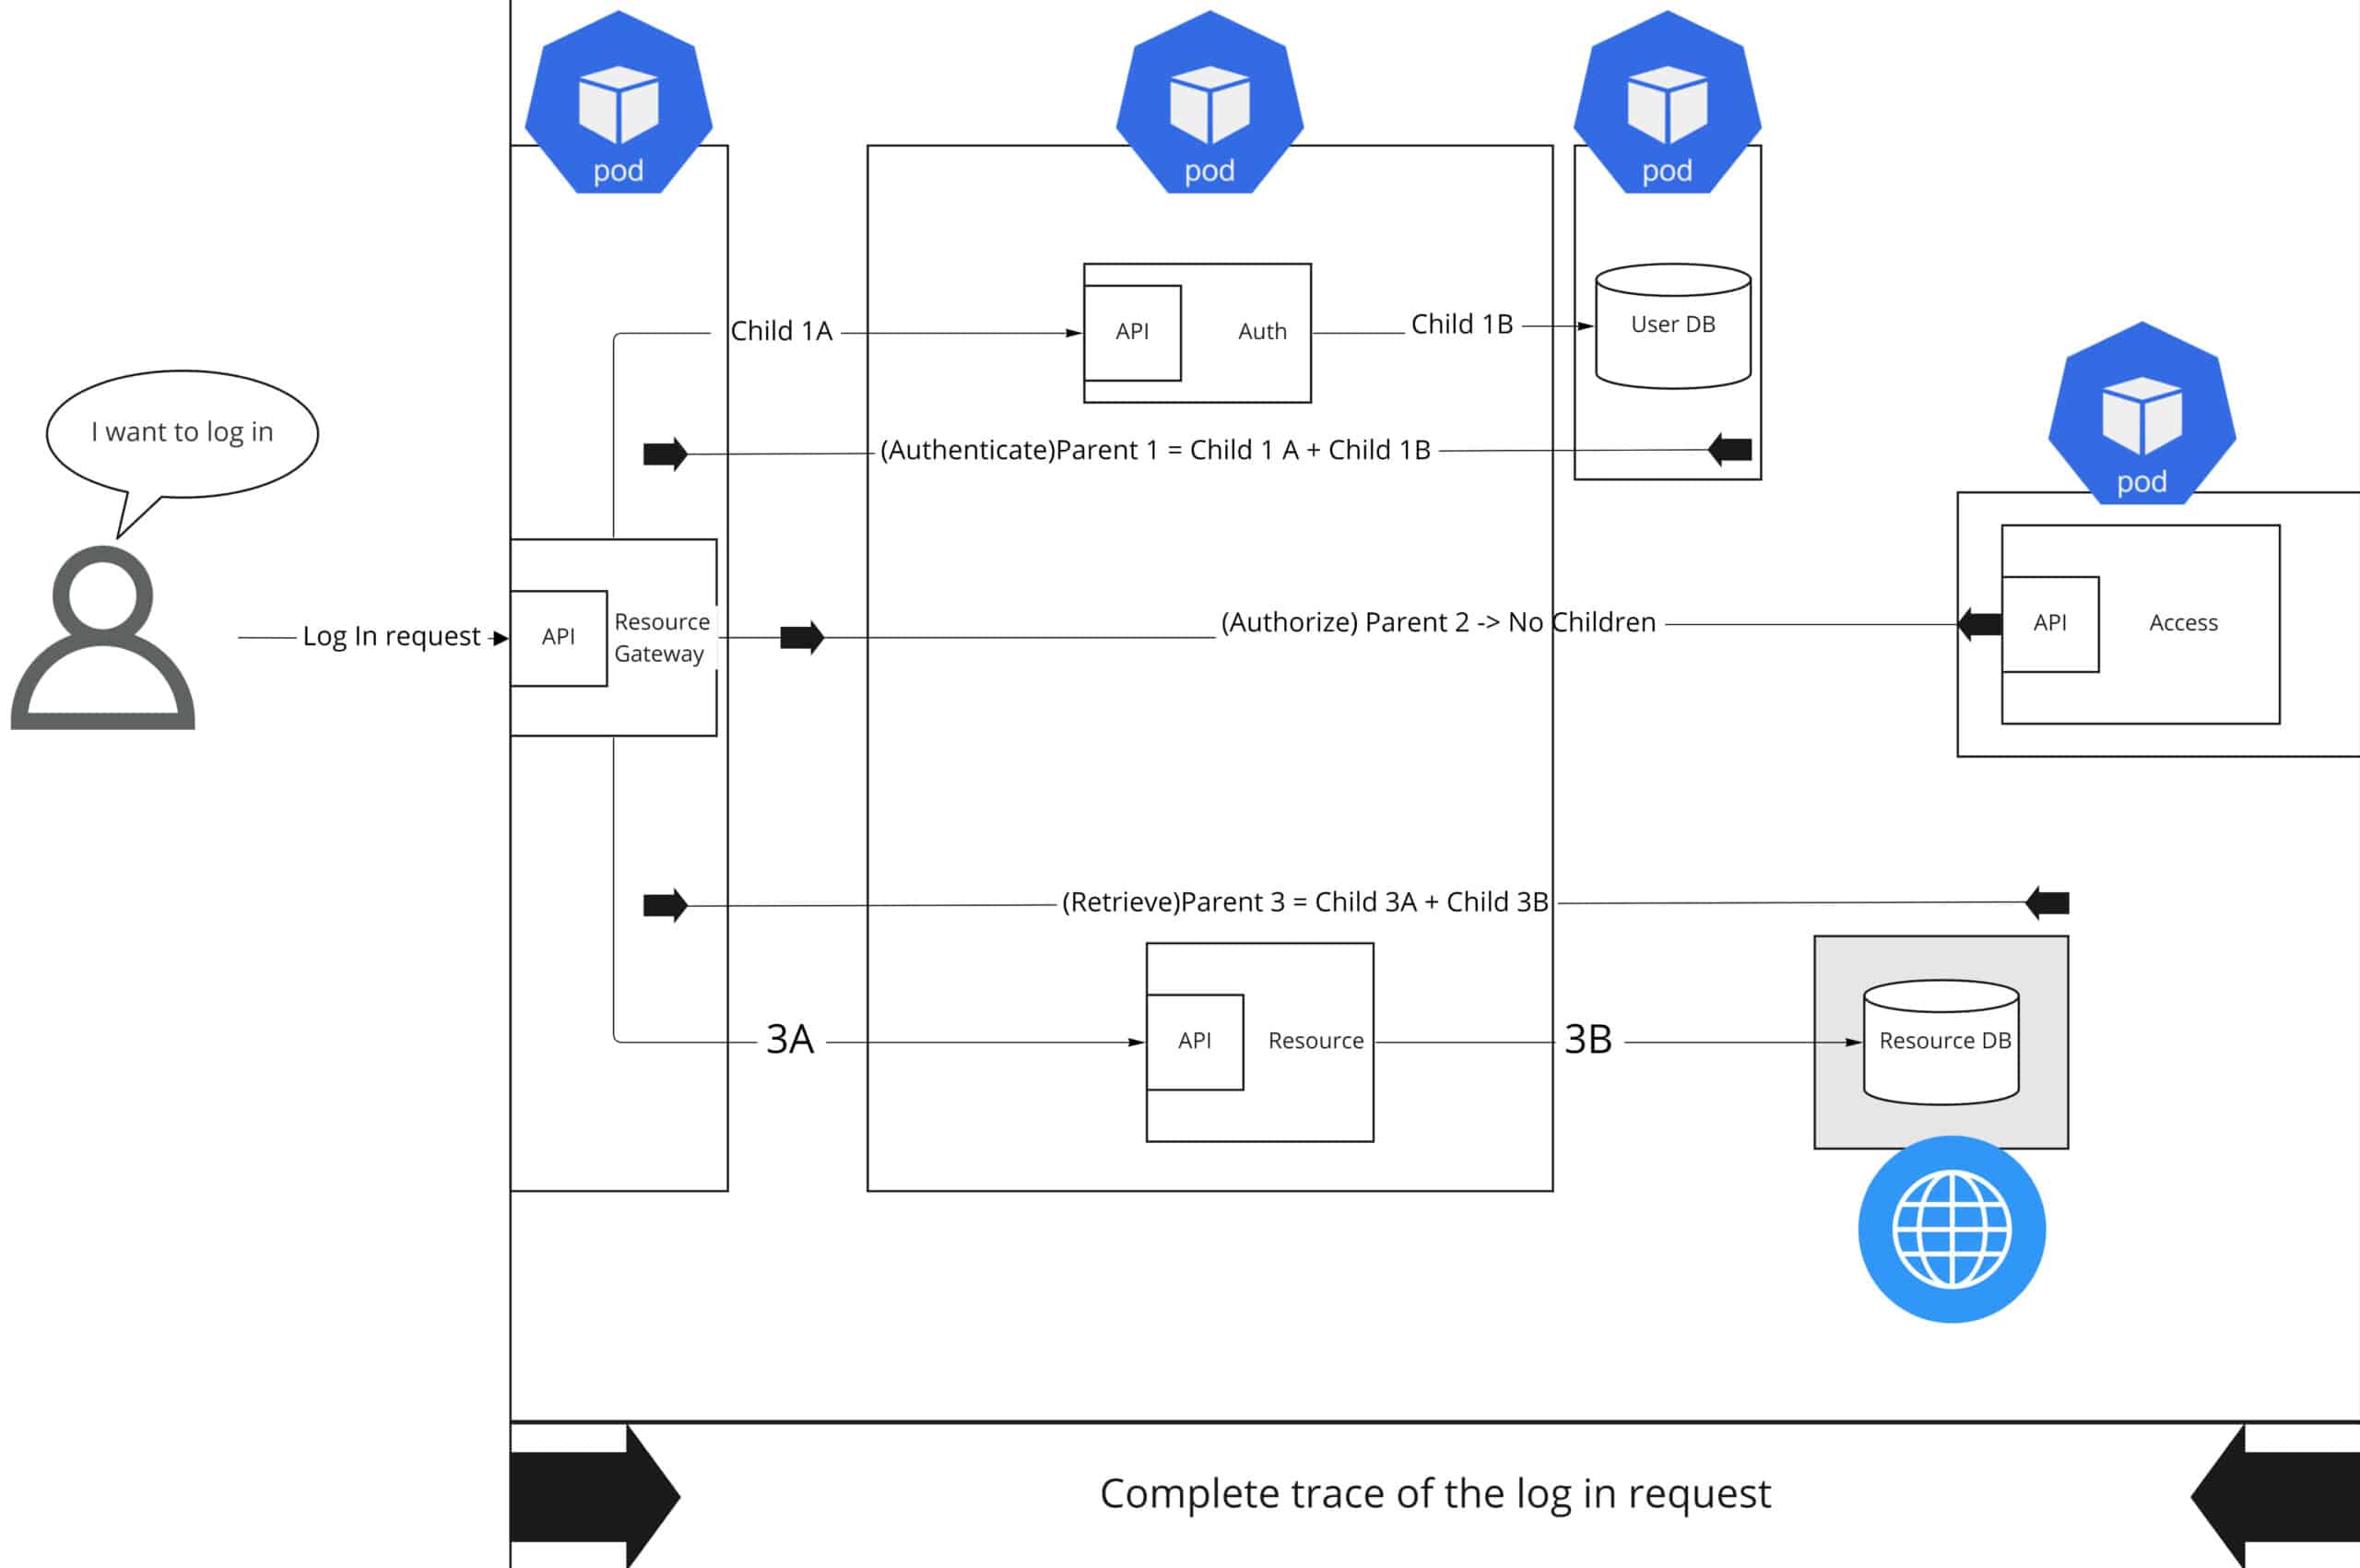
To solve the problem of tracking a request across services, distributed tracing introduces a few fundamental concepts. At its heart, it works by generating a unique ID when a request first enters the system and ensuring this ID is passed along with every subsequent call that is part of that original request.
Let's define the key terminology:
- Trace: The entire end-to-end journey of a single request. A trace is a collection of all the operations triggered by that request. It's identified by a unique Trace ID.
- Span: A single, named, and timed unit of work within a trace. Each service call, database query, or significant piece of business logic can be represented as a span. Each span has its own unique Span ID.
- Context Propagation: The mechanism for passing the trace context (including the Trace ID and the parent Span ID) from one service to the next. This is the "glue" that allows a downstream service to link its work back to the original trace.
The video below offers a concise visual explanation of these concepts.
Distributed Tracing Explained: Understanding Microservice Observability
Watch this short video, "Distributed Tracing Explained," by The Coding Gopher to see how these concepts fit together.
Watch from the beginning to understand the definitions of Trace, Span, and Context Propagation. Notice how the call tree on the left maps to the timeline of spans on the right.
The relationship between traces and spans is hierarchical. A trace is a tree of spans. The first span created is the "root span." When that service calls another, it creates a "child span," and the original span becomes its "parent."

To get a more detailed understanding of these building blocks, let's turn to a comprehensive article on the subject.
Distributed Tracing in Microservices: How It Actually Works
This article from Dash0 provides a thorough breakdown of the foundational concepts of distributed tracing.
Please read the following sections: Start with "What is distributed tracing?" to solidify its definition and purpose. Continue to "How distributed tracing works," focusing on the role of spans and trace context. Read "What is a trace?" and "Understanding spans: the building blocks of traces" for a deeper explanation of these two core components.
3. The Anatomy of a Span and Context Propagation
Now that we understand what traces and spans are, let's look closer at what information a span contains and how the context is actually passed between services. A simple "start" and "end" time isn't enough to be useful for debugging.
Span Contents
A span is a rich data structure containing:
- Identifiers: The Trace ID, its own unique Span ID, and the ID of its Parent Span.
- Name: A human-readable name for the operation it represents (e.g.,
HTTP GET /api/inventory/check,SELECT FROM products). - Timestamps: High-precision start and end times.
- Attributes (or Tags): A collection of key-value pairs that provide context about the operation (e.g.,
http.method: "GET",db.statement: "SELECT ...",user.id: "123"). These are crucial for filtering and analyzing traces. - Events: Timestamped log messages attached to a span, often used to record exceptions or other significant moments within the span's lifetime.
- Status: Indicates whether the operation succeeded or failed.
Context Propagation: The W3C Standard
How does the trace context travel from an upstream service to a downstream one? For interoperability between different languages, frameworks, and tracing tools, the industry has standardized on the W3C Trace Context specification.
For HTTP-based communication (like REST APIs), this standard defines two primary headers:
traceparent: Carries the essential identifiers—Trace ID, Parent Span ID, and sampling flags.tracestate: Carries vendor-specific information, allowing different monitoring tools to add their own metadata without breaking compatibility.
For gRPC, this same information is propagated using the gRPC metadata mechanism, which is conceptually equivalent to HTTP headers.
The article we looked at before has excellent sections covering these details.
Distributed Tracing in Microservices: How It Actually Works
Let's continue with the same article from Dash0 to explore the details of spans and context propagation.
Please read the following sections: "Attributes are what enable observability" to understand how attributes give spans their explanatory power. "Span events: the logs inside your trace" to see how events are used to capture moments like exceptions. "Connecting the dots with context propagation" to learn about the traceparent and tracestate headers defined by the W3C Trace Context standard.
4. The Tooling Ecosystem: OpenTelemetry and Jaeger
So, how do you add tracing to your applications? As with metrics, the industry standard for instrumenting your code is OpenTelemetry (OTel). OTel provides a set of APIs, SDKs, and libraries that handle the creation of spans and the automatic propagation of trace context for many popular frameworks, including FastAPI and gRPC.
Once your services are instrumented and generating trace data, you need a place to send it. This is the role of a tracing backend. The backend receives spans from all your services, assembles them into traces, and provides a UI for searching, visualizing, and analyzing them. A popular open-source example is Jaeger, originally created by Uber.
The goal is to produce visualizations like the one below, where you can see the entire lifecycle of a request across different services and databases, helping you immediately spot where time is being spent.
Conclusion
In this lesson, we have unveiled the third and final pillar of observability: distributed tracing. You now understand the fundamental concepts that enable you to track a request's journey across a complex microservices landscape.
Key Takeaways:
- Distributed tracing solves the problem of debugging and performance analysis in distributed systems, where logs and metrics alone are insufficient.
- A trace represents the end-to-end journey of a request and is composed of one or more spans.
- A span is a timed unit of work, enriched with attributes and events that provide crucial context.
- Context propagation is the mechanism that links spans together into a trace, typically using the W3C Trace Context standard via HTTP headers or gRPC metadata.
- OpenTelemetry is the industry standard for instrumenting applications to generate traces, which are then sent to a backend like Jaeger for analysis.
Preview of the Next Lesson
We have covered the "what" and "why" of distributed tracing. In the next lesson, we will move to the "how." You will get hands-on experience implementing these concepts, instrumenting our Python services to generate traces and seeing for yourself how trace context is automatically propagated across both gRPC and HTTP calls.