Welcome back! In our last lesson, we dove into structured logging, establishing the first of the three pillars of observability. We learned how to transform plain text logs into machine-readable JSON, which is crucial for analyzing behavior in a distributed system.
Today, we build on that foundation by tackling the second pillar: metrics. While logs tell you what happened in detail for a specific event, metrics give you the aggregated big picture. They are numerical representations of data measured over time, such as request counts, error rates, and response latencies. They are essential for real-time monitoring, building dashboards, and setting up alerts to proactively manage your system's health.
Our goal in this lesson is to instrument one of our Python gRPC services to generate and export these vital metrics. We will use the combination of OpenTelemetry, the industry standard for instrumentation, and Prometheus, the leading open-source tool for metrics collection and monitoring.
1. The Prometheus Monitoring Model
Before we write any code, it's important to understand how Prometheus works. Unlike logging systems where applications often push logs to a central collector, Prometheus operates on a pull model.
This means your application doesn't need to know where the Prometheus server is. Instead, your service simply exposes its current metrics on a specific HTTP endpoint (usually /metrics). The Prometheus server, which you configure separately, then periodically scrapes (or "pulls" from) this endpoint to collect the latest values.
How Prometheus Works - How to Collect Metrics
To get a clear picture of this architecture, watch this overview "How Prometheus Works" from That DevOps Guy.
Focus on the architecture diagram and explanation. Pay close attention to the "retrieval" component, the concept of "scrape configuration," and how the Prometheus server pulls metrics from application "targets."
This pull-based architecture makes your services simpler and more resilient. If your monitoring system is down, your application continues to run without issue, and Prometheus will simply catch up on the next successful scrape.
2. The Four Fundamental Metric Types
To measure different kinds of data effectively, Prometheus defines four distinct metric types. Choosing the right type is crucial for accurate monitoring and analysis.
- Counter: A cumulative metric that only ever increases or resets to zero (e.g., on a service restart). It's perfect for counting events like the total number of requests served or tasks completed. You use it to calculate rates, such as requests per second.
- Gauge: A metric that represents a single numerical value that can arbitrarily go up and down. Think of it as a snapshot of a current measurement, like memory usage, CPU load, or the number of active connections.
- Histogram: A more complex metric used to observe and record distributions of measurements, like request latencies or response sizes. It counts observed values into configurable buckets and also provides a sum and count of all observations. This allows you to calculate quantiles (e.g., 95th or 99th percentile latency) on the server side using PromQL, Prometheus's query language. This is highly aggregatable across services.
- Summary: Similar to a histogram, it also captures distributions. However, it calculates quantiles on the client side and exposes them directly. This makes it less flexible for aggregation across different instances of a service. For microservices, histograms are generally preferred.
Understanding Prometheus Metric Types | Meaning and Usage (Gauge, Counter, Summary, Histogram)
This video, "Understanding Prometheus Metric Types," from PromLabs provides an excellent and concise explanation of each type.
Watch the entire video to understand the purpose and usage of each metric type: Gauge Counter Summary Histogram Pay special attention to why you'd use a Counter for request totals and a Histogram for request latency.
3. Instrumenting a gRPC Service with OpenTelemetry
Now for the practical part. We'll add instrumentation to a simple gRPC "Greeter" service. We will use the grpc-observability library, which is a gRPC-specific package built on top of the OpenTelemetry framework. It automatically creates and updates the relevant metrics for us, such as call counters and latency histograms.
This process involves three key steps within our Python code:
- Start a Prometheus Exporter: This is a small HTTP server that runs inside our application process to expose the
/metricsendpoint. - Configure the OpenTelemetry SDK: We'll tell the SDK to use the Prometheus exporter we just started.
- Register the gRPC Plugin: We'll activate the gRPC instrumentation plugin, which will automatically intercept incoming and outgoing calls to record metrics.
The following guide from Google Codelabs provides a perfect walkthrough. We will follow its steps to instrument our service.
Setup Basic OpenTelemetry Plugin in gRPC Python
This codelab will guide you through instrumenting both a gRPC client and server. We will focus on the server-side instrumentation.
Read sections "Register the OpenTelemetry Plugin" and "Running the example and viewing metrics". We'll be applying the code changes described in step 3, specifically for observability_greeter_server.py. Don't worry about running the code just yet; we'll do that together in the next section.
Applying Instrumentation to the gRPC Server
Let's imagine you have a basic async gRPC server file, greeter_server.py. Based on the codelab, here are the modifications you would make.
First, install the necessary dependencies:
pip install grpcio grpcio-tools opentelemetry-sdk opentelemetry-exporter-prometheus prometheus-client grpc-observability
Now, let's modify greeter_server.py.
# greeter_server.py
import asyncio
import logging
from concurrent import futures

import grpc
import helloworld_pb2
import helloworld_pb2_grpc


# --- 1. Import new dependencies for metrics ---
import grpc_observability
from opentelemetry.exporter.prometheus import PrometheusMetricReader
from opentelemetry.sdk.metrics import MeterProvider
from prometheus_client import start_http_server

_PROMETHEUS_PORT = 9464
_SERVER_PORT = 50051

class Greeter(helloworld_pb2_grpc.GreeterServicer):
    async def SayHello(self, request: helloworld_pb2.HelloRequest,
                       context: grpc.aio.ServicerContext) -> helloworld_pb2.HelloReply:
        logging.info(f"Received request from {request.name}")
        return helloworld_pb2.HelloReply(message=f'Hello, {request.name}!')

async def serve() -> None:


    # --- 2. Start Prometheus client and configure OpenTelemetry ---


    # Start an HTTP server to expose metrics on the specified port.
    start_http_server(port=_PROMETHEUS_PORT, addr="0.0.0.0")


    # Create a MeterProvider with the PrometheusMetricReader.
    # This tells the OTel SDK to format metrics for Prometheus.
    meter_provider = MeterProvider(metric_readers=[PrometheusMetricReader()])


    # Create the OpenTelemetry gRPC plugin.
    otel_plugin = grpc_observability.OpenTelemetryPlugin(meter_provider=meter_provider)


    # Register the plugin globally. This will instrument all gRPC servers
    # and clients created in this process.
    otel_plugin.register_global()


    # --- 3. Create and start the gRPC server as usual ---
    server = grpc.aio.server() # No changes here
    helloworld_pb2_grpc.add_GreeterServicer_to_server(Greeter(), server)
    server.add_insecure_port(f'[::]:{_SERVER_PORT}')

    logging.info(f"Server started, listening on {_SERVER_PORT}")
    logging.info(f"Metrics exposed on http://localhost:{_PROMETHEUS_PORT}")

    await server.start()
    await server.wait_for_termination()

if __name__ == '__main__':
    logging.basicConfig(level=logging.INFO)
    asyncio.run(serve())
Notice how little our core application logic had to change. The grpc-observability plugin hooks into gRPC's interceptor mechanism to do all the heavy lifting for us. The register_global() call is what enables this automatic instrumentation for any grpc.aio.server() created after it runs.
4. Verifying and Visualizing Metrics
With the server instrumented, let's see the results.
Step 1: Run the Server and a Client
Start the greeter_server.py. Then, in another terminal, run a client to send some requests to it. This will generate metric data.
Step 2: Check the Raw Metrics
While the server is running, you can use curl to inspect the metrics endpoint directly:
curl http://localhost:9464/metrics
You will see a text-based output. Look for lines related to gRPC, such as:
# HELP grpc_server_call_started_total Total number of RPCs started on the server.
# TYPE grpc_server_call_started_total counter
grpc_server_call_started_total{grpc_method="SayHello",grpc_service="helloworld.Greeter"} 5.0


# HELP grpc_server_call_duration_seconds Server-side call latency.
# TYPE grpc_server_call_duration_seconds histogram
grpc_server_call_duration_seconds_bucket{grpc_method="SayHello",grpc_service="helloworld.Greeter",le="0.005"} 5.0


# ... other buckets ...
grpc_server_call_duration_seconds_sum{grpc_method="SayHello",grpc_service="helloworld.Greeter"} 0.00123
grpc_server_call_duration_seconds_count{grpc_method="SayHello",grpc_service="helloworld.Greeter"} 5.0
Here you can see the Counter (grpc_server_call_started_total) and the Histogram (grpc_server_call_duration_seconds) that the plugin created for us automatically.
Step 3: Scrape with Prometheus
The final step is to have a Prometheus instance scrape these metrics. Following the codelab's guidance, you would create a prometheus.yml file:
# prometheus.yml
global:
  scrape_interval: 15s

scrape_configs:
  - job_name: "greeter_service"
    static_configs:
      - targets: ["host.docker.internal:9464"] # Use this hostname to reach your host machine from a Docker container
You can then run Prometheus using Docker, mounting this configuration file. Since you have basic Docker experience, this command should be familiar:
docker run -d --name prometheus \
    -p 9090:9090 \
    -v $(pwd)/prometheus.yml:/etc/prometheus/prometheus.yml \
    prom/prometheus
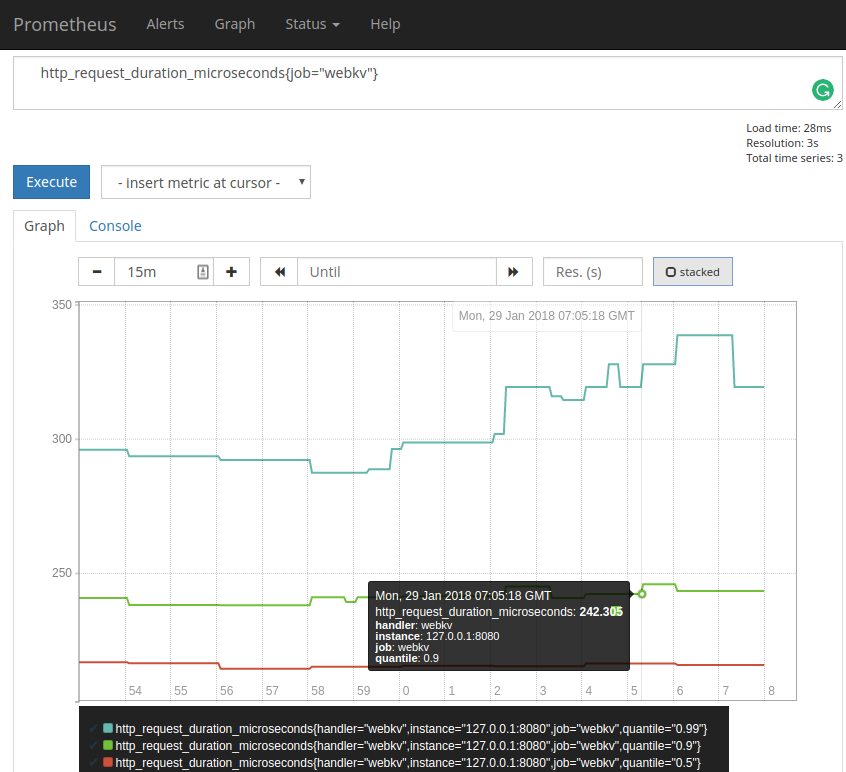
Now, open your browser to http://localhost:9090. In the query bar, you can start typing grpc_ and see the metrics from your service. You can execute a query like rate(grpc_server_call_started_total[1m]) to see the per-second request rate over the last minute.
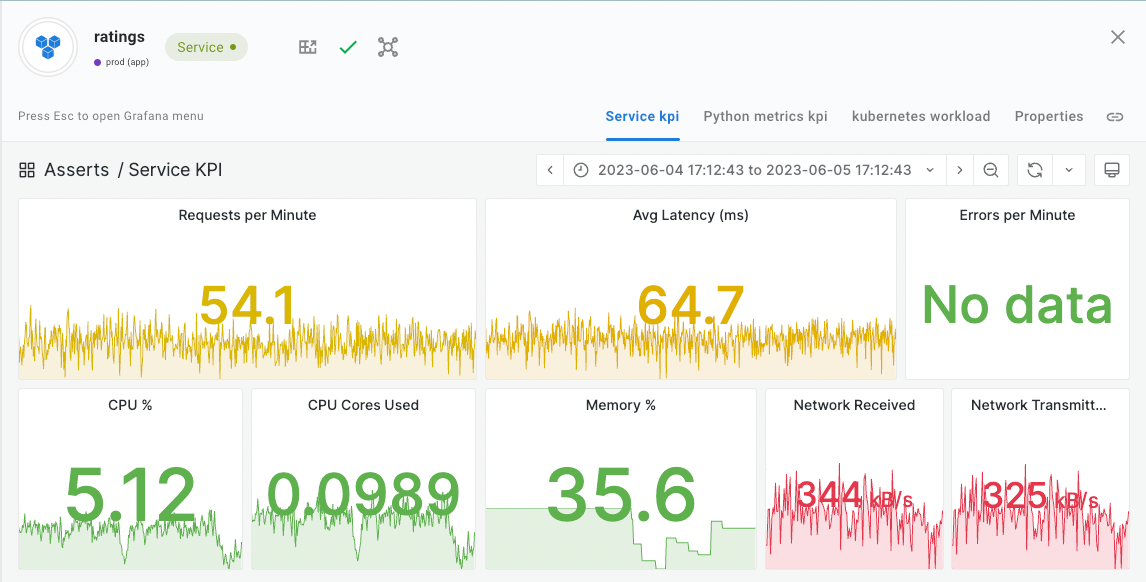
Eventually, you would connect a tool like Grafana to Prometheus to build comprehensive dashboards that show the health and performance of your services at a glance.
Conclusion
In this lesson, we have successfully instrumented a gRPC service to expose key performance metrics, completing the second pillar of our observability trifecta. You now have the tools to measure and quantify the behavior of your services in production.
Key Takeaways:
- Metrics are the second pillar of observability, providing aggregated, numerical data about your system's performance and health.
- Prometheus is a powerful monitoring system that operates on a pull model, scraping metrics from an HTTP endpoint exposed by your application.
- There are four key metric types: Counter, Gauge, Histogram, and Summary, each suited for different kinds of measurements.
- OpenTelemetry and its related libraries (like
grpc-observability) provide a standardized, low-effort way to instrument your Python services to expose Prometheus-compatible metrics. - The instrumentation process involves adding an exporter, configuring the OTel SDK, and registering a plugin, with minimal changes to your core application logic.
Preview of the Next Lesson
We have covered logging (what happened in a single event) and metrics (the aggregated big picture). But what happens when a request fails, and it involves five different services? How do you trace the entire journey of that request?
In our next lesson, we will explore the third and final pillar of observability: distributed tracing. You will learn how to track a request's lifecycle as it travels through multiple microservices, giving you a complete, end-to-end view of your system's operations.