Welcome! In the last lesson, we configured a zero-downtime rolling deployment for our microservice, ensuring it can be updated reliably without interrupting users. Now that our service is running resiliently, our next challenge is to gain visibility into its behavior. In a distributed system with many services, trying to debug an issue by reading plain text logs from multiple sources is inefficient and often impossible.
This is where structured logging comes in. Today's lesson focuses on configuring your Python microservice to emit logs in a structured JSON format. This makes them machine-readable, allowing for powerful querying, filtering, and analysis in modern log aggregation platforms. We'll explore how this practice is a foundational pillar of observability.
By the end of this lesson, you will be able to transform your application's log output from simple text strings into rich, contextual, and analyzable data streams.
The Case for Structured Logging
In a microservices architecture, a single user request might travel through several services. To trace its path or debug an error, you need to correlate logs from all of them. Plain text logs make this incredibly difficult.
Consider this traditional log entry:[ERROR] Failed to process payment for order 123. User 456.
Now, compare it to its structured counterpart:
{
  "level": "error",
  "event": "payment_processing_failed",
  "order_id": "ord-123",
  "user_id": "usr-456",
  "service": "payment-service",
  "timestamp": "2023-10-27T10:00:05Z"
}
The JSON log can be easily filtered by user_id, aggregated to count payment_processing_failed events, or used to build dashboards. This is the power we aim to unlock.
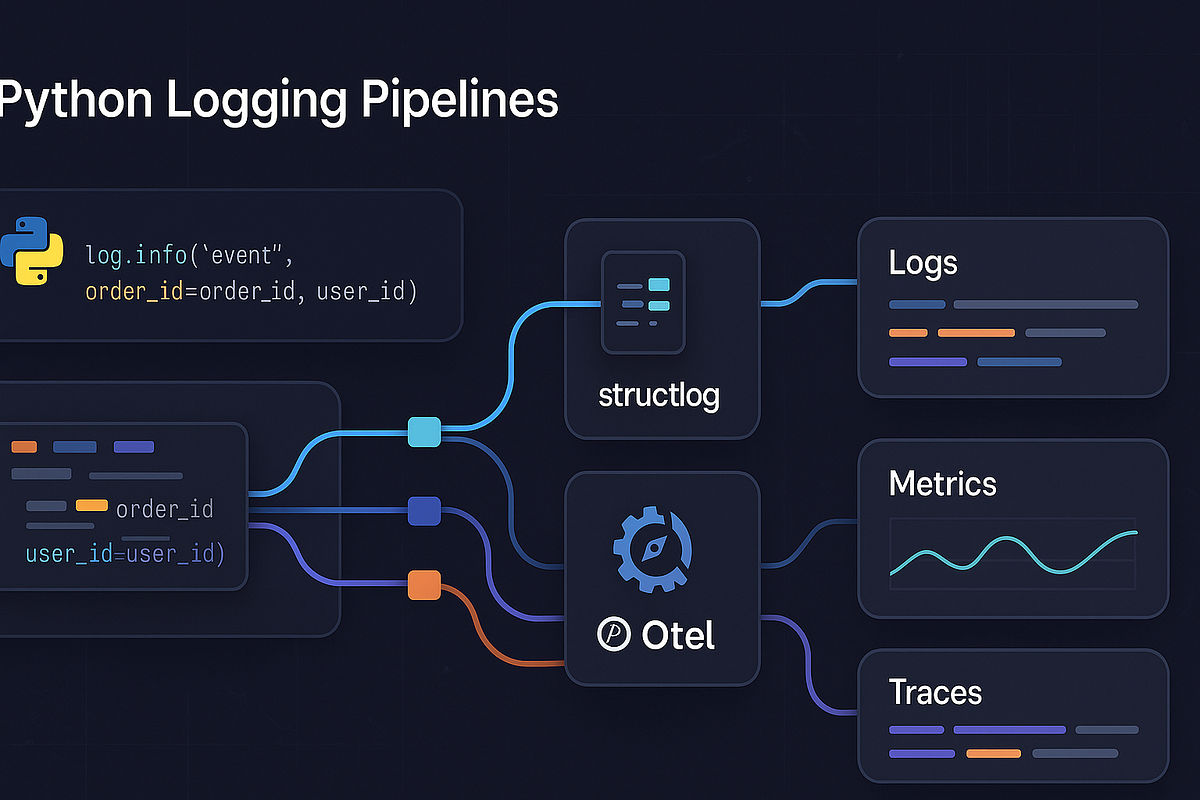
1. From First Principles: A Custom JSON Formatter
To understand what structured logging libraries do under the hood, let's start by looking at Python's built-in logging module. Its power lies in its components: Loggers, Handlers, and Formatters. The Formatter is what turns a LogRecord object into a string. By creating a custom formatter, we can serialize the log record into JSON.
This video provides an excellent overview of the logging module's architecture and demonstrates how to build a simple JSON formatter from scratch.
Watch "Modern Python logging" from the mCoding channel to solidify your understanding of the logging pipeline and see how a JSON formatter is built.
First, review the core components of the logging system. Then, focus on the section where a custom JSON formatter is created. Pay attention to how attributes from the LogRecord object are extracted and serialized into a JSON string.
Inspired by the video, here is a simple implementation of a JsonFormatter:
# custom_formatter.py
import json
import logging
from datetime import datetime, timezone

class JsonFormatter(logging.Formatter):
    def format(self, record: logging.LogRecord) -> str:


        # Create a dictionary with the log data
        log_object = {
            "timestamp": datetime.fromtimestamp(record.created, tz=timezone.utc).isoformat(),
            "level": record.levelname,
            "message": record.getMessage(),
            "logger_name": record.name,
        }


        # Add extra fields passed to the logger
        if hasattr(record, 'extra_data'):
            log_object.update(record.extra_data)


        # Add exception info if present
        if record.exc_info:
            log_object['exc_info'] = self.formatException(record.exc_info)

        return json.dumps(log_object)
This formatter produces logs in a format called JSON Lines (.jsonl), where each line is a self-contained, valid JSON object. This is a standard format for log files as it allows you to read and parse the file one line at a time without loading the entire file into memory.
2. The Production Approach: Centralized Configuration and python-json-logger
While writing a custom formatter is educational, for production systems, it's better to use well-maintained libraries and centralize your configuration. This makes your logging setup declarative, consistent, and easier to manage across different environments (dev, staging, prod).
We'll use python-json-logger, a popular library that provides a drop-in JSON formatter, and logging.config.dictConfig to apply a configuration from a YAML file.
Python Logging Module: A Complete Guide
This guide from Dash0 provides excellent, production-oriented patterns for Python logging.
First, read the section "Formatters define the output (and why it should be JSON)" to see how to install and use python-json-logger. Then, study "Centralizing logging configuration with the dictConfig pattern" to understand how to manage your logging setup cleanly using a YAML file.
Let's apply this to a microservice. First, install the necessary packages:pip install python-json-logger PyYAML
Next, create a logging_config.yaml file. This file declaratively defines our formatters, handlers, and loggers.
# logging_config.yaml
version: 1
disable_existing_loggers: false

formatters:
  json:
    (): pythonjsonlogger.jsonlogger.JsonFormatter
    format: "%(asctime)s %(name)s %(levelname)s %(message)s"
    rename_fields:
      levelname: level
      asctime: timestamp

handlers:
  console:
    class: logging.StreamHandler
    stream: ext://sys.stdout
    formatter: json

loggers:


  # The logger for our application
  my_app:
    level: INFO
    handlers: [console]
    propagate: no


  # Logger for third-party libraries (e.g., uvicorn, sqlalchemy)
  # We set it to WARNING to reduce noise, but they will still use our JSON format.
  root:
    level: WARNING
    handlers: [console]
In your application's main entry point (e.g., main.py for a FastAPI app), load and apply this configuration:
# main.py
import logging.config
import yaml
import uvicorn


# Load logging configuration
with open("logging_config.yaml", "r") as f:
    config = yaml.safe_load(f.read())
    logging.config.dictConfig(config)


# Get a logger for this module
logger = logging.getLogger("my_app")


# ... rest of your FastAPI app setup ...

@app.get("/")
def read_root():
    logger.info("Root endpoint was called.")
    return {"message": "Hello World"}

if __name__ == "__main__":


    # Disable uvicorn's default access log, as we'll handle logging in middleware
    uvicorn.run(app, host="0.0.0.0", port=8000, access_log=False)
When you run this application and hit the / endpoint, you'll see a JSON log line printed to your console.
3. Adding Context: The Key to Traceability
Structured logging's true power is realized when you add context to your logs. For a microservice, the most important piece of context is a request ID (or correlation ID). This unique identifier, when passed between services, allows you to trace a single user's request through the entire distributed system.
We can inject this context automatically using a FastAPI middleware and Python's contextvars.
Python Logging Module: A Complete Guide
This section of the guide explains how to add both static and dynamic context to your logs.
Read the section "Adding contextual attributes to Python logs", focusing on the subsection "Adding dynamic, per-request context". The example shows how to use a ContextFilter with contextvars and a FastAPI middleware to automatically inject a request_id into every log record generated during a request.
This pattern is so powerful because it decouples your application logic from the logging context. You set the context once at the boundary (in the middleware), and every log call made within that request's lifecycle is automatically enriched.
4. An Alternative: structlog for Advanced Pipelines
For even more powerful and flexible logging, many modern Python applications use structlog. Instead of a single formatter, structlog uses a processor pipeline. Each log event passes through a chain of functions (processors) that add, remove, or modify data before the final processor renders it as a string or JSON.
This makes it very easy to tailor your logging output for different environments. For example, during development, you might use a human-readable console renderer, while in production, you use a JSONRenderer.
Python's structlog: Modern Structured Logging
This blog post provides a great introduction to structlog and its philosophy.
Read the sections "Why Structured Logging?", "What is structlog?", "Integrating structlog with Python’s logging Module", "Structured JSON Logs", and "Production Logging Setup Example". This will give you a solid grasp of how structlog works and how to configure it for JSON output in a production setting.
Here's an example of how you might set up a logging middleware in FastAPI using structlog:

Configuring structlog involves setting up its processor chain. It integrates with the standard logging module, so it will also capture logs from third-party libraries and route them through its processors, ensuring all your output is consistently structured.
While python-json-logger is an excellent and simple way to get started with JSON logging, structlog is a more powerful tool that you will likely encounter and appreciate in complex, high-performance applications.
Conclusion
In this lesson, you've learned the critical importance of structured logging and how to implement it in a Python microservice. We've moved from basic text logs to rich, contextual JSON data streams ready for modern analysis tools.
Key Takeaways:
- Structured logs (JSON) are essential for observability in microservices, enabling easier parsing, searching, and correlation.
- Python's
loggingmodule can be configured for JSON output usingdictConfigand custom formatters or libraries likepython-json-logger. - Centralizing logging configuration (e.g., in a YAML file) is a production best practice.
- Injecting context, especially a
request_id, via middleware is crucial for tracing requests across service boundaries. structlogoffers a powerful, processor-based alternative for more advanced and flexible logging pipelines.
Preview of the Next Lesson
We have now established one of the three pillars of observability: logging. In the next lesson, we will tackle the second pillar: metrics. You will learn how to instrument your gRPC service to generate and export basic application metrics, such as request counts and latency. These metrics are vital for real-time monitoring, creating dashboards, and setting up alerts to proactively manage your system's health.