Welcome back! In our last lesson, we explored the "what" and "why" of distributed tracing, establishing it as the crucial third pillar of observability. You learned about traces, spans, and the concept of context propagation, which pieces together the journey of a request across your microservices.
This lesson transitions from theory to practice. Our goal is to implement trace context propagation for both HTTP and gRPC calls in Python. You will see firsthand how OpenTelemetry libraries "magically" connect traces between services and then we'll dissect that magic to understand exactly how it works under the hood. By the end, you'll be able to ensure that a request flowing from a RESTful API gateway to a backend gRPC service appears as a single, unified trace.
1. The Broken Trace Problem
Let's start with a common scenario. You have two services: Service-A (an API gateway, perhaps using FastAPI) and Service-B (a downstream service, also FastAPI). Service-A receives an external request and makes an HTTP call to Service-B using the popular requests library.
Even if both services are instrumented with OpenTelemetry for FastAPI, you'll find that your tracing backend (like Jaeger) shows two separate, disconnected traces. Why? Because while the server-side instrumentation is active, the client-side call made with requests isn't configured to carry the trace context forward.
This video demonstrates this exact problem and its surprisingly simple solution.
OpenTelemetry: How distributed tracing really works with Python, FastAPI and requests
This video, "OpenTelemetry: How distributed tracing really works," by Adam Gardner, provides a perfect demonstration of context propagation for HTTP calls.
First, watch the segment that sets up the problem. Notice how Jaeger displays two distinct traces, one for app-1 and one for app-2, because the trace context is lost during the HTTP call. Next, watch how this is fixed. The key is adding the auto-instrumentation library for the requests module. See how this results in a single, correctly stitched trace in Jaeger.
As you saw, the fix was to install and enable the OpenTelemetry instrumentation for requests (opentelemetry-instrumentation-requests). This library patches requests to automatically inject the current trace context into the outgoing HTTP headers of any request it makes.
2. How Injection and Extraction Work: The traceparent Header
The "magic" of auto-instrumentation lies in two key operations: injection and extraction.
- Injection: The client-side instrumentation (e.g.,
requests-instrumentor) takes the currentTrace IDandSpan IDand serializes them into a carrier, which for HTTP is a set of request headers. - Extraction: The server-side instrumentation (e.g.,
fastapi-instrumentor) inspects incoming request headers for that carrier, deserializes the context, and creates a new server-side span that is correctly parented to the client's span.
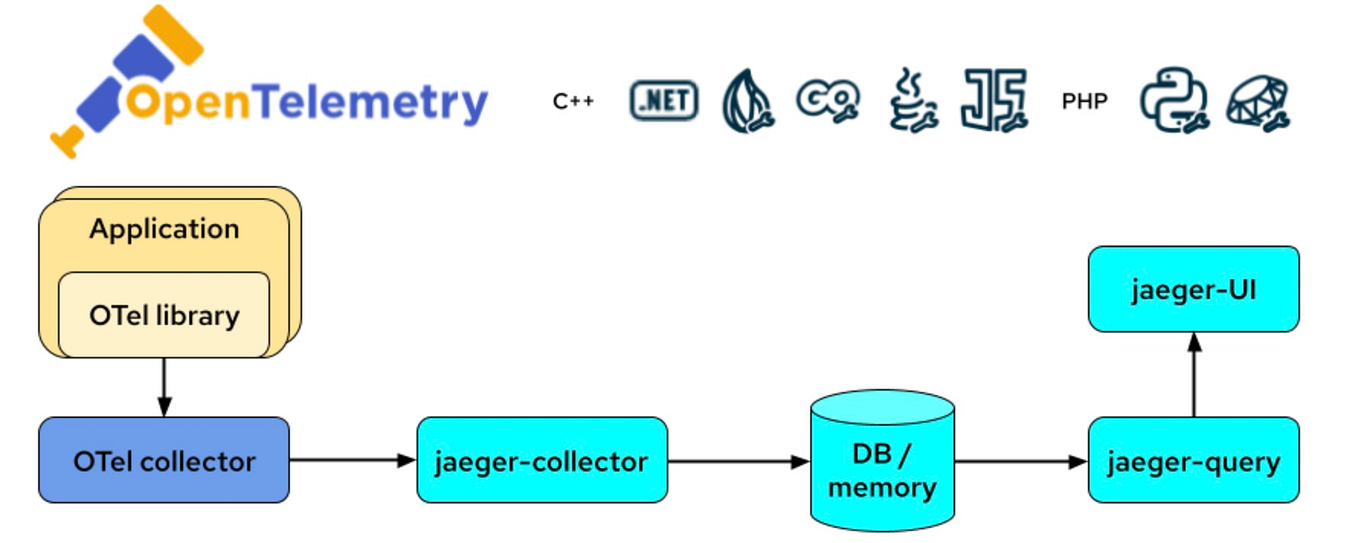
For HTTP, the standard carrier is the W3C traceparent header. Let's look at its structure.
OpenTelemetry: How distributed tracing really works with Python, FastAPI and requests
Let's return to Adam Gardner's video to see a detailed breakdown of the traceparent header.
Watch the segment from the deep dive into the traceparent header. Pay close attention to its four parts: version, trace-id, parent-span-id, and trace-flags. Understanding this format demystifies how the link between services is created. Also, watch the summary section, which reinforces the concept and warns about intermediate proxies or load balancers that might strip these headers, a common cause of broken traces in production.
The traceparent header format is version-trace_id-parent_span_id-trace_flags.
For example: 00-0af7651916cd43dd8448eb211c80319c-b7ad6b7169203331-01
00: The version of the spec.0af...: The 16-byte Trace ID, which remains constant for the entire request journey.b7a...: The 8-byte Span ID of the parent span (inService-A).01: The trace flags, indicating if the trace is being sampled.
When Service-B receives this header, its instrumentation knows to start a new span whose parent is b7ad6b7169203331 and which belongs to the trace 0af7651916cd43dd8448eb211c80319c. This is how the trace is stitched together.
The following reading provides further detail on these fundamental mechanics.
How to Use OpenTelemetry Context Propagation
This article from OneUptime gives a clear, concise explanation of the core principles of context propagation.
Please read the first two sections: "1. What Is Context Propagation": This reinforces the definition and shows the key metadata fields. "2. How Context Flows Through Systems": This section formally defines Injection and Extraction and includes a helpful flowchart.
3. Context Propagation in gRPC
The principles for gRPC are identical to HTTP, but the carrier mechanism is different. Instead of HTTP headers, gRPC uses metadata to pass context.
Automatic Instrumentation for gRPC
Just like with requests, OpenTelemetry provides auto-instrumentation libraries for gRPC that handle propagation automatically.
pip install opentelemetry-instrumentation-grpc
When you instrument your gRPC client and server, the libraries automatically add interceptors that perform the injection and extraction.
GrpcInstrumentorClient().instrument(): This patches your gRPC client code. Before an RPC is sent, an interceptor injects the trace context into the call's metadata.GrpcInstrumentorServer().instrument_server(server): This adds an interceptor to your gRPC server. Before a method is executed, it extracts trace context from the incoming call's metadata.
The article "How to Monitor Python gRPC Services with OpenTelemetry" you have access to (resource_id="[LINK](https://oneuptime.com/blog/post/2026-02-06-monitor-python-grpc-services-opentelemetry/view)") shows complete examples of this in the "Instrumented gRPC Server" and "Instrumented gRPC Client" sections. The key takeaway is that by calling the instrument() functions, propagation becomes automatic.
A Deeper Look: Manual Propagation with gRPC Interceptors
To truly understand what the auto-instrumentation is doing, it's valuable to see how you could implement it manually. You can write your own gRPC interceptors that use the OpenTelemetry propagate API directly.
This is exactly what your goal of gaining a deep, practical understanding calls for. Let's examine how to build these interceptors.
How to Use OpenTelemetry Context Propagation
This section of the article provides complete, practical Python code for manual gRPC context propagation.
Focus on section "5. gRPC Context Propagation". Study both code blocks carefully: gRPC Client with Context Injection: Examine the TracingClientInterceptor. Locate the line propagate.inject(metadata). This is the core of the injection logic. It serializes the active trace context into the metadata dictionary, which is then attached to the outbound gRPC call. gRPC Server with Context Extraction: Examine the TracingServerInterceptor. Find the line parent_context = propagate.extract(metadata). This is where the server reads the metadata from the incoming call and deserializes it back into a context object. Notice that this parent_context is then used when starting the new server-side span: tracer.start_as_current_span(..., context=parent_context, ...). This explicitly creates the parent-child link.
By studying this manual implementation, you can see that there's no real "magic." The auto-instrumentation libraries are simply providing pre-built interceptors that perform these exact inject and extract operations for you.
4. Debugging Broken Traces
What do you do when your traces are still disconnected?
- Verify Injection: At the client, log the headers or metadata just before the outbound call is made. Are the
traceparent(for HTTP) or equivalent gRPC metadata keys present and valid? If not, the injection step is failing, likely due to a misconfiguration or the call being made outside of an active span. - Verify Extraction: At the server, log the incoming headers or metadata. Are they arriving as expected? As the video mentioned, it's common for intermediate layers like API gateways, proxies, or load balancers to strip unknown headers. If the
traceparentheader is being stripped in transit, the trace will break.
The following article provides a practical Python snippet for debugging the extraction process.
How to Use OpenTelemetry Context Propagation
Let's quickly look at the debugging section of the same article.
Read section "9. Debugging Broken Traces". Pay special attention to the Python code block under "Verify Headers Are Being Extracted". This debug_incoming_request function is a great utility to have in your toolbox when troubleshooting propagation issues.
Conclusion
In this lesson, you have put the theory of context propagation into practice. You now have the knowledge to ensure traces flow seamlessly across service boundaries, which is fundamental to achieving true observability in a distributed system.
Key Takeaways:
- Trace context propagation is what "stitches" spans from different services into a single trace.
- OpenTelemetry's auto-instrumentation libraries for
requestsandgrpchandle propagation automatically by injecting and extracting context. - For HTTP, the context is carried in the
traceparentheader. - For gRPC, the context is carried in gRPC metadata.
- The core OpenTelemetry operations are
propagate.inject()on the client side andpropagate.extract()on the server side. - You can implement propagation manually using gRPC interceptors for deeper control and understanding.
- When debugging broken traces, always verify that context is being successfully injected by the client and received by the server.
Preview of the Next Lesson
You have now mastered the individual components of building, deploying, and observing microservices. It's time to bring everything together. The next module marks the beginning of our end-to-end project, where we will design and build a complete e-commerce system from scratch using Async Python, gRPC, FastAPI, Docker, and all the observability patterns we've learned. In the first lesson of that module, we will start with the most critical step: designing the service boundaries and API contracts.