Hello! Welcome to the final lesson in our module on Google Ads.
In our last session, you learned the practical steps to configure and launch a Performance Max campaign, creating distinct asset groups for a hotel's different services, like 'General Room Bookings' and 'Wedding Venue Hire'. Launching the campaign is a huge milestone, but the work of a great marketer is just beginning.
Now that your campaign is live and gathering data, it's time to learn how to analyze its performance. This lesson will teach you how to interpret the key reports within PMax. Think of it this way: you've sent out different brochures (your asset groups) to potential customers. Now, you need to check which brochures are bringing in the most bookings and why.
Our goal today is to evaluate the performance of PMax by analyzing asset and listing group reports. This will empower you to make data-driven decisions to stop wasting money, double down on what works, and continuously improve your campaign's profitability.
The Hierarchy of PMax Analysis
Because PMax is so automated, it's helpful to analyze it from the top down. A structured approach prevents you from getting lost in the data. We'll follow this order:
- Asset Group Performance: At a high level, which of your strategies is working best? Is it the 'Room Bookings' group or the 'Wedding Venues' group that's driving more value?
- Listing Group (Hotel Property) Performance: Which specific hotel properties or room types are performing best? This is the hotel-specific version of e-commerce product reporting.
- Individual Asset Performance: Within a successful asset group, which specific images, headlines, and videos are resonating most with your audience?
- Audience & Search Insights: Who is Google's AI finding, and what are they searching for? This is where you find new opportunities.
Let's dive into each level.
1. Asset Group Performance: The 30,000-Foot View
Your first stop should always be the Asset Groups report. This tells you how your core themes are performing against each other. For your hotel, you can directly compare the results of your 'General Room Bookings' asset group against your 'Wedding & Event Venues' group.
To find this, navigate to your PMax campaign and click on Asset Groups in the left-hand menu. You'll see a table with your asset groups listed as rows.
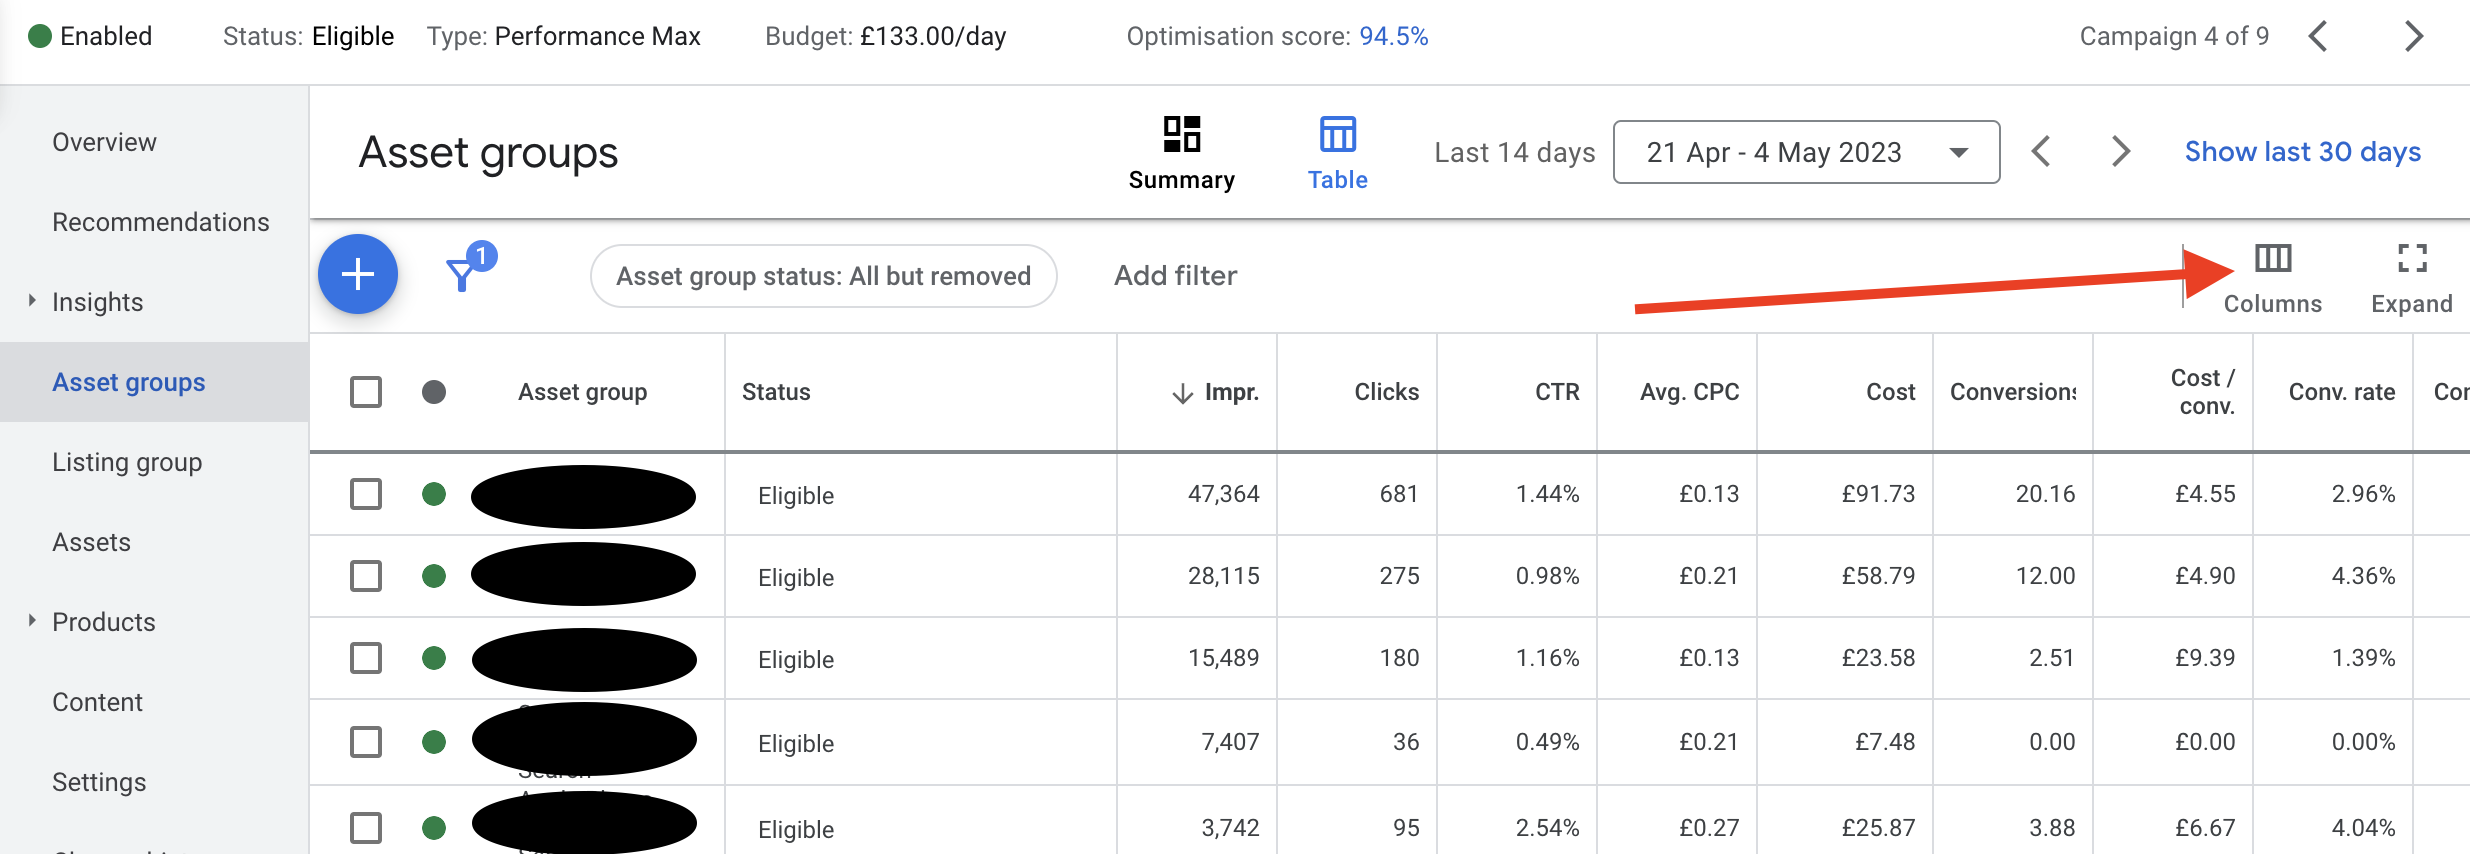
The key questions to ask here are:
- Which asset group has the highest Conversion value / cost (ROAS)?
- Which has the lowest Cost / all conv. (Cost Per Acquisition)?
- Is one group spending a lot of money but not generating conversions?
To get a deeper understanding of how to interpret this data and what actions to take, the following article provides an excellent breakdown.
7 Key PMax Reports For Campaign Optimization
This article from Analyzify, '7 Key PMax Reports For Campaign Optimization', provides a clear guide to the most important reports. We'll start with the first one.
Please read section 1, 'Asset Group Performance: Measuring Combination Effectiveness'. Pay close attention to the boutique hotel scenario they use to interpret the data. This will help you contextualize the metrics for your own business.
Based on this analysis, you might decide to allocate more budget to the winning asset group or pause an underperforming one to rethink your creative assets or audience signals.
2. Hotel Property Performance: The Hotelier's "Listing Group"
The learning outcome mentions "listing group reports." In the world of e-commerce, this is where a marketer sees which specific products are selling. For you, as a hotelier using PMax for travel goals, Google provides a much more relevant equivalent: the Hotels tab.
This report allows you to see performance data for each individual hotel property you included in your campaign setup. If you manage a single hotel, you can even use this to see performance segmented by different factors. This is a crucial report that is unique to your industry.
About the Hotels tab for Performance Max for travel goals ...
This official Google Support page explains the purpose and location of the 'Hotels' tab within PMax for travel goals.
Read the introductory paragraphs, the 'View the Hotels tab' section, and the 'Understand the Hotels tab' section. You don't need to memorize every metric, but understand that this is where you go to see property-level performance data.
Strategic Application: Imagine you run two hotels. The Hotels tab might show that 'Hotel A' has a great ROAS but low booking volume, while 'Hotel B' gets lots of bookings but at a lower ROAS. This insight might lead you to create a new, dedicated PMax campaign just for Hotel A, giving it its own budget to see if you can scale its successful performance.
3. Individual Asset Performance: Optimizing Your Creatives
Once you've identified a promising asset group (e.g., 'General Room Bookings' is performing well), the next step is to drill down and see which individual creative assets are driving that success. PMax gives every asset—every headline, description, image, and video—a performance rating:
- Best: A top-performing asset.
- Good: A solid, well-performing asset.
- Low: An underperforming asset.
- Pending: Not enough data yet to assign a rating.
Your job is to act as an editor: cut what's not working and commission more of what is. This video provides a perfect walkthrough of how to find and use this report.
How To Optimize Performance Max Campaigns (Google Ads)
In this video, 'How To Optimize Performance Max Campaigns', Ben Heath gives a very clear and practical demonstration of how to analyze asset performance.
Watch from 01:00 to 04:35. Focus on how he navigates to the 'View details' section of an asset group and uses the 'Performance' column to identify strong and weak assets. Notice his thought process: 'What about this headline is working well?' and 'Let's create more videos like this best-performing one.'
The optimization cycle here is simple but powerful:
- Review the performance ratings for your assets.
- Pause any assets with a 'Low' rating.
- Analyze your 'Best' performing assets. What do they have in common? Are they showing people enjoying the hotel? Do they mention a specific benefit like "free breakfast"?
- Create new assets that are inspired by your 'Best' performers and add them to the asset group.
Test your understanding!
You are reviewing the 'Wedding & Event Venues' asset group. You see the following performance ratings:
- Image: A professional photo of your empty ballroom. Rating: Low
- Image: A photo of a happy couple during their reception in the ballroom. Rating: Best
- Headline: "Function Room for Hire". Rating: Low
- Headline: "Create Your Dream Wedding Day". Rating: Best
Based only on this information, what are your next two strategic actions for this asset group?
Show answer
- Pause the underperformers: You should pause the image of the empty ballroom and the "Function Room for Hire" headline. They are clearly not resonating with the audience.
- Create more 'Best'-inspired assets: The data suggests that emotional, benefit-driven creative works best. You should source more images of real weddings and happy guests, and write new headlines that focus on the dream/emotional outcome, such as "An Unforgettable Venue for Your Special Day" or "Celebrate Your Love Story With Us."
4. Audience & Search Insights: Finding New Opportunities
Finally, PMax gives you valuable insights into the search terms that are triggering your ads and the audience segments that are converting. This is where you can discover new customer behaviors and refine your targeting.
Navigate to the Insights tab in your campaign.
- Search Term Insights: This shows you the categories of searches that led to conversions. You might discover that a term like "pet-friendly hotels in [city]" is driving a lot of valuable bookings. This could inspire you to create a whole new asset group dedicated to travelers with pets.
- Audience Insights: This shows you which audience segments are performing well. Google will show you both the "Signal" audiences (the ones you provided) and "Optimized" audiences (new ones the AI discovered). If Google finds a new, high-converting audience segment, you can add it as a signal to your asset group to further guide the AI.
This second clip from the same video clearly explains how to interpret these reports.
How To Optimize Performance Max Campaigns (Google Ads)
Let's return to Ben Heath's video to see how to use the Insights tab.
Watch from 11:45 to 14:50. Pay attention to how he differentiates between 'Signal' and 'Optimized' audiences and how you can use the search term data to discover unexpected but valuable keywords.
Conclusion
You've now learned the complete analytical workflow for Performance Max. It's not a "set it and forget it" tool; it's a powerful engine that requires a skilled operator to review the data and provide better "ingredients" over time.
Key Takeaways:
- Analyze top-down: Start with Asset Groups, then drill down to Hotel Properties, and finally to individual Assets.
- Compare Asset Groups: Use metrics like ROAS and Cost Per Acquisition to determine which of your core strategies (e.g., rooms vs. events) is most effective.
- Use the
Hotelstab: This is your industry-specific version of a listing group report and is crucial for understanding property-level performance. - Optimize creatives relentlessly: Continuously pause 'Low' performing assets and replace them with new variations inspired by your 'Best' performers.
- Mine the
Insightstab: Use search term and audience reports to discover new targeting opportunities and refine your audience signals.
What's Next?
This lesson concludes our deep dive into the major Google Ads campaign types. You've learned how to build and analyze campaigns across Search, Display, Video, and now Performance Max.
In the next module, Cross-Platform Strategy & Budgeting, we will zoom out. We'll start connecting the dots between your Google Ads efforts and your Meta Ads experience. You'll learn how to develop a full-funnel strategy where each platform has a specific role, how to allocate your budget between them, and how to create a cohesive brand experience for your potential guests.