Welcome to the first lesson of our new module, Meta Ads: Optimization & Analysis. In the previous module, we concentrated on the strategic decisions you make when setting up your campaigns, such as choosing the right objective and deciding between Ad Set Budgets (ABO) and Campaign Budget Optimization (CBO).
Now, we shift our focus from setup to evaluation. Launching a campaign is only the beginning. The key to long-term success and profitability for your hotel lies in understanding what happens after you click "Publish." This lesson is designed to meet the learning outcome: Navigate Ads Manager to analyze performance by audience, placement, and creative. You'll learn how to move beyond top-level metrics and dissect your campaign data to find actionable insights that will drive your optimization efforts.
1. The Analyst's Mindset: "What" vs. "Why"
Your experience running Meta ads means you're already familiar with the Ads Manager interface. However, effective analysis requires a specific mindset. It's not enough to know if a campaign is profitable; you need to understand the underlying reasons.
A powerful framework for this is to separate your metrics into two categories:
- Primary Metrics (The "What"): These metrics tell you what is happening and are directly tied to your business goals. For a hotel, this typically includes Bookings (Purchases), Cost per Booking (CPA), and Return on Ad Spend (ROAS). You make your big optimization decisions based on these—like increasing a budget or pausing an ad.
- Secondary / Storytelling Metrics (The "Why"): These metrics help explain why your primary metrics look the way they do. They tell a story about audience engagement and ad efficiency. Key examples include Frequency, Click-Through Rate (CTR), and video engagement rates.
Before we can analyze, we need to set up our workspace in Ads Manager to see all this data in one view. The default column setup is rarely sufficient.
How to Analyze Facebook Ads Data the Right Way (The 2026 Guide)
To understand this concept better and see a recommended column setup, let's watch this video from digital marketing strategist Dara Denney. She provides an excellent walkthrough of the essential metrics and how they fit into the 'What vs. Why' framework.
Please watch from 00:56 to 09:11. Focus on: The four primary metrics that show if your campaign is working (Amount Spent, Purchases, Cost per Purchase, ROAS). The metrics that tell you about the audience you're reaching (Frequency, Reach, CPM). The metrics that indicate creative performance (CTR, CPC, Hook/Hold Rates).
Based on the video and best practices for the hospitality industry, a strong custom column set in Ads Manager would include:
- Primary (The "What"): Amount Spent, Results (e.g., Bookings), Cost per Result (Cost per Booking), Purchase ROAS.
- Audience Health (The "Why"): Frequency, Reach, Impressions, CPM (Cost Per 1,000 Impressions).
- Creative & Landing Page (The "Why"): CTR (Link Click-Through Rate), CPC (Cost per Link Click), Landing Page Views.
- Video Creative (The "Why"): 3-Second Video Plays (for Hook Rate), Video Average Play Time.
Setting up your columns this way gives you a powerful dashboard to begin your analysis.
2. Analyzing by Audience and Placement: The "Breakdown" Tool
Your most powerful tool for this analysis is the Breakdown feature in Ads Manager. It allows you to segment your campaign data to see how different cohorts are performing. This is where you find the gold.
The Ultimate Guide to Facebook Ads Analytics in 2026
The article 'The Ultimate Guide to Facebook Ads Analytics' from Improvado provides a clear overview of this process. Let's read a short section that introduces the Breakdown feature.
Please read the section titled '3. Use Breakdowns for Deeper Insights'. It concisely explains how you can slice your data by Time, Delivery (audience), and Action (placement).
Let's apply this to your hotel.
Audience Analysis (The "Who")
By breaking down your data by demographics, you can understand exactly who is responding to your ads.
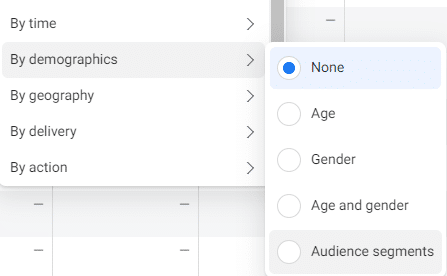
How to use it: Go to the "Breakdown" menu and select options like Age, Gender, or Region.
- Hotel Example: You're running a campaign for a "Family Summer Package." By breaking down the data, you discover that while you're reaching all age groups, the 35-44 age group has a 3x higher ROAS than any other group. Furthermore, you see that people from cities within a 3-hour drive are converting at a much lower cost than those from further away.
- Actionable Insight: This tells you to create a new ad set specifically targeting this high-performing demographic and geographic segment, potentially with a more tailored message.
Placement Analysis (The "Where")
This breakdown shows you where your ads are being shown across Meta's network and how each placement performs.

How to use it: In the "Breakdown" menu, select Placement.
- Hotel Example: You are running video ads showing off your hotel's new infinity pool. The breakdown reveals that Instagram Reels have a very low Cost Per 1,000 Impressions (CPM) and high video view rates, but a very low CTR and almost no bookings. Meanwhile, Instagram Stories have a higher CTR and are driving 80% of your bookings, albeit at a higher CPM.
- Actionable Insight: This suggests that Reels are effective for building top-of-funnel awareness, but Stories are your conversion driver. You could adjust your strategy to use Reels for branding campaigns and allocate more of your conversion campaign budget to Stories placements.
Another excellent way to visualize these breakdowns is with the "View Charts" feature, as demonstrated in this next clip.
How To Analyse Facebook Ads The RIGHT Way
Let's watch a clip from Ben Heath's video 'How To Analyse Facebook Ads The RIGHT Way'. He demonstrates how to use the 'View Charts' feature to get a clear, visual report on demographic and platform performance.
Watch from 24:47 to 27:30. Pay attention to how he analyzes the gender and platform (Facebook vs. Instagram) breakdowns and considers what actions he might take based on that data.
3. Analyzing Creative Performance: Beyond Clicks
Analyzing which ad creative is "best" goes deeper than just looking at which one has the highest ROAS. You need to diagnose why it's the best, so you can replicate its success.
Quantitative Creative Analysis (The Numbers)
Here, we use our secondary metrics to diagnose creative strengths and weaknesses.
- CTR (Link Click-Through Rate): A high CTR suggests your image/video and ad copy are compelling enough to make people want to learn more. A low CTR is a strong signal that your creative isn't resonating with your audience.
- Hook Rate (First 3 seconds): For video ads, this is crucial. A high hook rate means your video's opening is effective at stopping the scroll.
- Video Average Play Time / Hold Rate: This tells you if the rest of your video is engaging after the hook.
Hotel Diagnosis Example:
You are testing two video ads for a "Romantic Getaway" package.
- Ad A (Drone shot of the hotel exterior): Has a high Hook Rate but a low CTR and low ROAS.
- Ad B (Couple clinking glasses on a balcony): Has a slightly lower Hook Rate but a much higher CTR and a great ROAS.
Diagnosis: The drone shot (Ad A) is eye-catching but doesn't tell a story that connects with the "romantic getaway" motivation. The couple on the balcony (Ad B) immediately communicates the desired experience, leading to more qualified clicks and bookings. The insight is to focus on creative that shows the experience, not just the building.
Qualitative Creative Analysis (The Story & Vibe)
This is where you go beyond the numbers and analyze the creative elements themselves. As Dara Denney explained in the first video, this involves looking at:
- Format: UGC (User-Generated Content) vs. a polished professional video? Carousel vs. single image?
- Messaging: Is the winning ad's copy focused on a discount ("20% Off"), a benefit ("Unforgettable Views"), or urgency ("Book Now, Limited Rooms")?
- Imagery: What is the subject of the winning image? The pool? A luxurious room? A smiling family?
By tagging your ads with these qualitative features (you can even do this in the ad name, e.g., Video_UGC_PoolView_BenefitCopy), you can start to spot trends over time about what truly resonates with your audience.
Test your understanding!
You're running a campaign for your hotel's restaurant. You have one ad that is underperforming with a low ROAS. You look at the secondary metrics and see a high CTR (3%) but a very low number of Landing Page Views compared to the number of link clicks. The number of actual dinner reservations (your conversion event) is almost zero.
Based on this data, where is the most likely problem: the ad creative, the audience targeting, or the landing page?
Show answer
The most likely problem is with the landing page or the technical setup.
A high CTR indicates that the ad creative and targeting are working well—the ad is compelling enough to make the right people click. However, the large drop-off between clicks and landing page views suggests a technical issue, such as a very slow-loading page. The fact that even those who do land don't convert points to a problem on the page itself: perhaps the booking widget is broken, the menu is hard to find, or the page content doesn't match the promise of the ad. The ad itself has done its job.
Conclusion
You now have a structured process for analyzing your Meta ad campaigns that goes far beyond a surface-level glance at ROAS.
Key Takeaways:
- Adopt the "What vs. Why" mindset, using primary metrics for decisions and secondary metrics for diagnosis.
- Set up a custom column view in Ads Manager to have all your key data readily available.
- Use the Breakdown feature to analyze performance by Audience (age, gender, region) and Placement (Facebook Feed, Instagram Stories, etc.) to discover your most profitable segments.
- Analyze Creative performance both quantitatively (CTR, Hook Rate) to diagnose issues and qualitatively (messaging, format, imagery) to understand what story resonates with your guests.
What's Next?
Analyzing performance is about understanding what happened in the past. The next logical step is to use these insights to systematically improve future performance. In our next lesson, we will cover how to implement A/B tests to systematically improve campaign elements, turning your analytical insights into a repeatable process for growth.