Welcome back. In our last lesson, we designed a system to detect when a model's performance degrades due to data or concept drift. That detection is the trigger, but what's the action? The most common response is to retrain a new model candidate. But deploying a new model into a complex, high-stakes production environment is fraught with risk. How can you be sure the new model is actually better? How do you deploy it without compromising system stability or the user experience?
This lesson directly addresses that critical step. We will achieve the learning outcome: Implement A/B testing and canary deployment strategies for comparing ML models in production. You will learn how to roll out new models safely and measure their impact scientifically. This is a cornerstone of MLOps and a frequent topic in elite-level system design interviews, blending engineering, statistics, and product sense.
We will follow our established five-concept structure:
- The Deployment Dilemma: An Overview of Production Testing Strategies
- Canary Deployments: Engineering for Safe, Progressive Rollouts
- A/B Testing Fundamentals: The "Peeking" Problem
- Advanced A/B Testing: Sequential Analysis for Fast, Rigorous Decisions
- Designing an End-to-End Model Validation System
1. The Deployment Dilemma: An Overview of Production Testing Strategies (Easy)
-
Technical Explanation:
After retraining, you have a new model candidate (v2) that you believe outperforms the current production model (v1). Simply swappingv1forv2(a "Big Bang" deployment) is extremely risky. Any unforeseen bugs, performance regressions, or negative business impacts would affect 100% of your users instantly.Progressive Delivery is a set of strategies to mitigate this risk by gradually exposing the new version to users while monitoring its behavior. For ML models, we care about two classes of metrics:
- Technical Metrics: Latency, CPU/memory usage, error rates. Is the new model stable and performant?
- Business/Product Metrics: Click-through rate, conversion, user engagement. Does the new model actually improve the user experience and achieve business goals?
Three common strategies are:
- Blue-Green Deployment: Run two identical environments. Route all traffic to the "blue" (old) environment. Deploy the new version to the "green" environment. Once it's confirmed healthy, switch all traffic from blue to green. It offers instant rollback but is expensive and doesn't test the new version with a subset of live traffic.
- Canary Deployment: Gradually shift a small percentage of live traffic (e.g., 1%, 5%, 10%) to the new version. This is ideal for catching technical regressions with minimal blast radius.
- A/B Testing: Route traffic to two or more versions simultaneously, with each user consistently seeing one version. This is a randomized controlled experiment designed to scientifically measure differences in business metrics.
-
Metaphor for a 5-Year-Old:
You're a chef at a big restaurant.- Big Bang: You throw out the old ketchup recipe and replace it with a new spicy one for everyone, all at once. If people hate it, the whole restaurant is unhappy.
- Blue-Green: You have two identical kitchens. You make the new spicy ketchup in the second kitchen. When you're ready, you instantly swap all the old ketchup bottles with the new ones.
- Canary: You give the new spicy ketchup to just one table (the "canaries"). If they don't complain, you give it to a few more tables. You're watching to see if anyone's food catches on fire (technical regression).
- A/B Testing: You give the old ketchup to half your customers and the new spicy one to the other half. You then count how many people from each group finish their fries to see which ketchup is truly "better" (business metric).
-
Anchor Resource & Visualization:
This image clearly illustrates the difference in traffic splitting for each strategy.
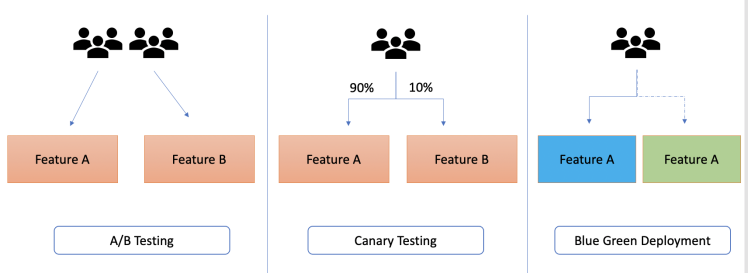
*This diagram shows how user traffic is handled in A/B Testing (split audience), Canary Testing (small subset gets new feature), and Blue-Green Deployment (traffic switches between two environments).*

To get a quick overview, the ByteByteGo channel provides a concise explanation.
Top 5 Most-Used Deployment Strategies
Watch this segment from 'Top 5 Most-Used Deployment Strategies' to understand the high-level concepts of Canary deployments and a related technique, Feature Toggles, which are often used to implement A/B tests.
Watch the section on Canary Deployment (05:24 - 07:52) and the section on Feature Toggles (07:52 - 09:11). Note how canary focuses on gradual rollout for safety, while toggles allow for precise control over who sees a feature, which is the basis for A/B testing.
2. Canary Deployments: Engineering for Safe, Progressive Rollouts (Medium)
-
Technical Explanation:
The core of a canary deployment is controlling traffic routing. There are two primary mechanisms to achieve this in a modern microservices environment (like Kubernetes):-
Pod Scaling (The Simple Way): You have a deployment of your model service. To route 10% of traffic to
v2, you configure the service to have 9 pods runningv1and 1 pod runningv2. The Kubernetes service object, acting as a basic load balancer, will distribute traffic roughly according to this ratio.- Pro: Simple to implement.
- Con: Inflexible and imprecise. You can't get fine-grained control (e.g., 1% traffic requires 100 pods). It couples traffic management with resource scaling.
-
Traffic Splitting (The Advanced Way): You deploy both
v1andv2as separate, fully-scaled deployments. You then use a smarter routing layer, like a service mesh (e.g., Istio, Linkerd) or an API Gateway, to precisely split traffic. You can configure a rule that says "send 99% of requests to thev1service and 1% to thev2service."- Pro: Precise, declarative control over traffic percentages. Decouples traffic management from scaling. Enables advanced routing based on headers or user identity.
- Con: Requires more complex infrastructure (a service mesh).
The goal of the canary is to monitor technical metrics. An automated system watches the
v2model's error rate, latency, and resource usage. If these metrics exceed predefined thresholds, the rollout is automatically aborted and traffic is routed back tov1, minimizing the "blast radius." -
-
Metaphor for a 5-Year-Old:
You're controlling the water flow in two pipes, one with old water (v1) and one with new water (v2).- Pod Scaling: You have 10 small faucets. To get 10% new water, you open 1 faucet for the new water and 9 for the old water. It's clunky.
- Traffic Splitting: You have one big, smart valve. You can set it precisely: "1% new water, 99% old water." It's much more accurate and powerful.
-
Anchor Resource (YAML Configuration):
Instead of Python, a configuration file is more representative of how this is implemented. The following video provides an excellent deep dive into the engineering mechanics. We will reference its concepts and configuration patterns.
Testing in Production! Progressive Delivery with Canary Deployments Explained!
This video, 'Testing in Production! Progressive Delivery with Canary Deployments Explained!', is a fantastic end-to-end demonstration. It shows how to use tools like Argo Rollouts and Istio to manage canary deployments.
This video is dense but highly valuable. Watch it in segments: (00:00 - 05:10): Understand the 'why' behind testing in production and progressive delivery. (05:10 - 13:38): See the simple pod-scaling canary strategy and its limitations. (13:38 - 18:35): Grasp the superior traffic-splitting approach using a service mesh (Istio). (18:35 - 26:45): This is the most critical part for MLOps. See how Prometheus metrics are integrated to automate the canary analysis and rollback based on technical performance.
3. A/B Testing Fundamentals: The "Peeking" Problem (Medium)
-
Technical Explanation:
While a canary deployment confirms technical stability, an A/B test determines business value. Here, we compare the performance ofv1(control) andv2(treatment) on a business metric like CTR.The standard statistical approach is Null Hypothesis Significance Testing (NHST):
- Null Hypothesis (): There is no difference in CTR between the two models. .
- Alternative Hypothesis (): There is a difference. .
You collect data for a pre-determined duration (e.g., 2 weeks), then run a statistical test (like a Z-test for proportions) to get a p-value. If (our significance level ), we reject and conclude
v2is different.The "Peeking" Problem: In a fast-moving tech environment, waiting two weeks is painful. Engineers are tempted to "peek" at the results daily. However, every time you run a statistical test on accumulating data, you give yourself another chance to find a false positive. This dramatically inflates the Type I error rate. A test designed for a 5% false positive rate can easily end up with a 30-50% rate if you peek repeatedly.
-
Metaphor for a 5-Year-Old:
You're trying to prove your friend has a "lucky coin" that lands on heads more often. You decide to flip it 100 times.- Correct Way: You flip it 100 times, count the heads, and then decide.
- Peeking: You flip it 10 times, check the count. Flip 10 more, check again. And again. By random chance, you're likely to find a short streak that looks "lucky" (e.g., 8 heads in 10 flips). If you stop your experiment right there, you've fooled yourself. You didn't prove the coin was lucky; you just stopped when randomness looked interesting.
-
Python Snippet (Demonstrating the Peeking Problem):
This code, inspired by the OLX tech blog, simulates A/A tests (comparing a model against itself) to show how peeking inflates the false positive rate.import numpy as np from scipy import stats def simulate_peeking(num_days=30, samples_per_day=1000, alpha=0.05): """ Simulates an A/A test where we 'peek' at the results every day. Since treatment and control are from the same distribution, any 'win' is a false positive. """ control_data = [] treatment_data = [] for day in range(num_days): # Collect new data for the day control_data.extend(np.random.normal(loc=0, scale=1, size=samples_per_day)) treatment_data.extend(np.random.normal(loc=0, scale=1, size=samples_per_day)) # Perform a t-test (the 'peek') _, p_value = stats.ttest_ind(control_data, treatment_data, equal_var=False) if p_value < alpha: # We found a 'significant' result and stopped early. This is a false positive. return 1 # If we never found a significant result after all days, it's a true negative. return 0 # Run the simulation many times num_simulations = 1000 false_positives = 0 for _ in range(num_simulations): false_positives += simulate_peeking() false_positive_rate = false_positives / num_simulations print(f"Nominal false positive rate (alpha): {0.05}") print(f"Actual false positive rate with peeking: {false_positive_rate:.3f}") # The actual rate will be much higher than 5%!
4. Advanced A/B Testing: Sequential Analysis for Fast, Rigorous Decisions (Hard)
-
Technical Explanation:
How do elite companies like Netflix and OLX solve the peeking problem? They use sequential analysis, which allows for continuous monitoring while rigorously controlling the false positive rate. The key idea is to use adjusted stopping boundaries that change over time.-
Group Sequential Testing (GST): You define a fixed number of "interim analyses" (checkpoints). At each checkpoint, you compare your test statistic (e.g., a Z-score representing the difference in CTR) against pre-calculated boundaries.
- Efficacy Boundary: If the statistic crosses this upper boundary, you can stop the test and declare a winner. This boundary is very conservative early on (requiring a huge effect) and becomes more lenient as more data is collected.
- Futility Boundary: If the statistic crosses this lower boundary, it means the new version is highly unlikely to ever show a significant effect. You can stop the test early for "futility," saving time and resources.
-
Anytime-Valid Inference: A more advanced method used by Netflix. Instead of discrete checkpoints, it produces "confidence sequences" that are valid at any point in time. You can watch the confidence interval for the difference in metrics shrink over time, and if it no longer contains zero, you can declare a winner.
-
-
Metaphor for a 5-Year-Old:
You are in a car race that lasts 10 laps.- Efficacy Boundary: To win early, you can't just be slightly ahead after Lap 1. You must be ahead by a massive margin (half a lap). But by Lap 9, you only need to be ahead by a few feet to be declared the winner. The "finish line" gets easier to cross as the race goes on.
- Futility Boundary: If your car breaks down and you're 3 laps behind by Lap 4, the officials can declare you've lost. There's no point in making you drive the remaining 6 laps.
-
Anchor Resource (Theory and Practice):
These two articles from OLX and Netflix are the definitive guides to this topic. They are technical but provide the "under the hood" understanding you're looking for.
Speed with Rigor: testing smarter with group sequential ...
The article from OLX, 'Speed with Rigor', is a masterclass in Group Sequential Testing. It explains the theory behind controlling for peeking.
Focus on these key ideas: 'Peeking is a trap': Understand the simulation that proves the problem (which we replicated in Python). 'How GST avoids...': The core concept of predefined checkpoints and boundaries. 'Efficacy Boundaries': How thresholds for an early 'win' are defined. Pay attention to the O'Brien-Fleming boundary concept. 'Incorporating Futility Boundaries': How to stop losing experiments early.
Sequential A/B Testing Keeps the World Streaming Netflix ...
The Netflix tech blog, 'Sequential A/B Testing Keeps the World Streaming', provides a real-world application of these ideas, focusing on 'anytime-valid' tests for technical metrics.
Focus on: Section 2: How Netflix monitors client performance and needs to detect shifts in the entire distribution, not just the mean. Section 3: Their clear illustration of the 'peeking' problem. Section 4: The concept of using 'anytime-valid confidence sequences' to continuously monitor for differences without inflating error rates. Note the animated GIF showing the confidence band shrinking and eventually excluding zero.
5. Designing an End-to-End Model Validation System (Harder)
-
Technical Explanation:
Let's architect a system that combines canary deployments and sequential A/B testing for a new ML model (v2).- Deployment & Routing: A CI/CD pipeline (e.g., using Argo Workflows) deploys
v2. Argo Rollouts configures an Istio virtual service to start a canary rollout. Initially, 1% of traffic is routed tov2. - Automated Canary Analysis (Technical Metrics): Argo Rollouts is configured to query a Prometheus time-series database every minute. It checks a query like
rate(http_requests_total{service="model-v2", code=~"5.."}[1m]). If the 5xx error rate forv2exceeds a threshold (e.g., 0.5%) or its p99 latency spikes, the rollout is automatically aborted. - Progressive Rollout: If
v2passes the technical checks, Argo Rollouts automatically increases the traffic in stages (e.g., to 5%, 25%, 50%), running the canary analysis at each stage. - Experimentation Logging: The model-serving application logs every request to a Kafka topic. The log includes the user ID, which model version they saw (
v1orv2), and the prediction. A separate stream processor joins this with downstream events (e.g.,click,purchase) and writes the enriched data to a data lake (e.g., S3/Delta Lake). - Sequential A/B Analysis (Business Metrics): A scheduled Spark job runs every hour. It reads the latest data from the data lake and performs a group sequential analysis on the key business metric (e.g., CTR). It compares the current Z-score against the pre-calculated efficacy and futility boundaries for that time step.
- Decision & Promotion:
- If the futility boundary is crossed, the system alerts the team and automatically triggers a full rollback via the Argo Rollouts API.
- If the efficacy boundary is crossed, the system declares
v2a winner and promotes it to 100% traffic. - If neither is crossed, the experiment continues.
- Deployment & Routing: A CI/CD pipeline (e.g., using Argo Workflows) deploys
-
Metaphor for a 5-Year-Old:
Launching a new video game patch (v2).- Deployment: The new patch is sent to 1% of players.
- Canary Analysis: An automated system watches for game crashes or extreme lag among the
v2players. If it sees any, it instantly rolls everyone back tov1. - Progressive Rollout: If it's stable, the patch goes to 5%, then 25% of players.
- Logging: The system records what patch each player has and if they win their matches (the business metric).
- A/B Analysis: A stats robot checks the win rates every hour. It uses the special "race rules" (sequential analysis). If it becomes obvious
v2players are losing way more (futility), it aborts the patch. Ifv2players are winning way more (efficacy), it declares the patch a success. - Decision: If the patch is a success, it's rolled out to everyone.
-
Architectural Blueprint:
The following MLOps pipeline shows where these validation steps fit.

*This architecture illustrates the final stages of an MLOps workflow. The model, once deployed, is subjected to 'Staging' and 'Canary Integration Tests'. This is where our automated technical (canary) and business (A/B) analyses would run before a full production rollout.*
Test your understanding! (System Design Interview Question)
You are designing the deployment strategy for a brand new, complex, and computationally expensive ranking model for a social media feed. The old model was a simple chronological sort. The new model aims to increase user engagement (time spent on the feed). Your CTO is risk-averse but also wants to see results quickly.
- Would you choose a Canary or a Blue-Green deployment strategy for the initial rollout? Why? What specific metrics would you monitor?
- How would you design an A/B test to prove the new model increases user engagement?
- Your Product Manager wants to know if the new model is working after just one day. How do you respond, and what statistical framework would you use to give them a rigorous answer without waiting for weeks?
Show answer
1. Initial Rollout Strategy:
A Canary deployment is the far superior choice here.
- Why: The new model is described as "complex and computationally expensive." This presents significant technical risk. A canary rollout allows us to expose the model to a tiny fraction of live traffic (e.g., 0.1%) to check for technical regressions before they impact the entire user base. A Blue-Green deployment would switch 100% of traffic at once, which is too risky given the model's complexity.
- Metrics to Monitor (Canary Analysis):
- p99 Latency: Is the new model too slow? A spike here would be a critical failure.
- CPU/GPU Utilization: Is the expensive model causing servers to overload?
- Memory Usage: Are there memory leaks?
- 5xx Error Rate: Is the model crashing under specific real-world request patterns?
2. A/B Test Design:
Once the model is technically stable, I would expand the traffic split to 50/50 for a proper A/B test.
- Setup: Users would be randomly assigned to either the
controlgroup (chronological feed) or thetreatmentgroup (new ranking model). This assignment must be sticky; a user should stay in their assigned group for the duration of the experiment. - Primary Metric: The primary business metric is
user_engagement. I would define this concretely as "average session time per user per day" or "average scroll depth per user". - Guardrail Metrics: I would also monitor guardrail metrics to check for negative side effects, such as
number of posts liked/commented,app open rate, or evenapp uninstall rate. We don't want to increase session time by making the feed frustrating to use.
3. Responding to the "One-Day Peek" Request:
This is a classic stakeholder management challenge that tests knowledge of advanced statistics.
- Initial Response: I would explain to the PM the danger of "peeking" and making decisions based on noisy, early data. I would show them a chart illustrating how the false positive rate increases with repeated checks, explaining that a "win" after one day is likely due to random chance, not a real effect.
- The Rigorous Solution: I would tell them that instead of ad-hoc peeking, we will use a Group Sequential Test (GST) framework.
- My Proposal: "We can't give you a definitive answer after one day, but we don't have to wait two weeks either. We have designed the experiment with pre-defined daily checkpoints. At each checkpoint, we will compare our results against statistical boundaries."
- Efficacy: "If the new model shows an overwhelmingly positive and statistically robust increase in engagement after a few days, our sequential test will allow us to stop the experiment early and declare a winner."
- Futility: "Conversely, if the new model is clearly performing poorly, the test will allow us to stop it early for futility, saving resources and preventing further negative user experience."
This approach addresses the PM's need for speed while maintaining statistical rigor, demonstrating a mature understanding of modern experimentation practices.
Conclusion
You have now bridged the gap between model training and production reality. You understand that deploying a new model is not a single action but a carefully managed process of risk mitigation and scientific validation.
Key Takeaways:
- Progressive Delivery is essential for safe deployments. Canary rollouts are for managing technical risk, while A/B tests are for measuring business impact.
- The engineering of a canary rollout involves either pod scaling (simple but coarse) or traffic splitting via a service mesh (complex but precise). Automation is key to monitoring technical metrics and enabling rapid rollback.
- Standard A/B testing is vulnerable to the "peeking problem," where repeatedly checking results inflates false positives.
- Sequential Analysis (like GST) solves this by using pre-defined stopping boundaries (efficacy and futility), allowing for early, statistically valid decisions.
- An end-to-end system combines these concepts: an automated canary analysis for technical stability, followed by a sequential A/B test for business value.
Next Lesson Preview
You've now proven your new model v2 is better and safely rolled it out. But what if it's computationally expensive? Running large models at scale can be costly. In our next lesson, we will explore techniques to shrink your model without sacrificing too much accuracy: Apply model optimization techniques like quantization and knowledge distillation for efficient deployment.