Welcome back! In our last lesson, we designed the core architectures for serving ML models in production, covering online, batch, and asynchronous inference. But deploying a model is just the beginning. The real world is dynamic, and a model that was accurate yesterday might be obsolete today. This degradation in performance is a critical challenge in MLOps.
Today, we will tackle this head-on. This lesson directly addresses the learning outcome: Explain data drift and concept drift, and design a monitoring system to detect model degradation. Mastering this is non-negotiable for building reliable, high-performing AI systems at an elite level, as it ensures your models deliver sustained value instead of silently failing.
We will deconstruct this topic using our five-concept structure:
- The Core Problem: Understanding Model, Data, and Concept Drift
- Quantifying Change: How to Measure Data Drift
- Tracking Relationships: How to Measure Concept Drift
- The Guardian System: Designing a Model Monitoring Architecture
- From Alert to Action: Remediation Strategies for Drift
1. The Core Problem: Understanding Model, Data, and Concept Drift (Easy)
-
Technical Explanation:
Model Drift (or model degradation) is the general term for a model's loss of predictive power over time. It's the symptom, not the cause. The two primary underlying causes are Data Drift and Concept Drift.- Data Drift (or Feature Drift): This occurs when the statistical properties of the input data change. The world the model sees is different from the world it was trained on. Mathematically, the distribution of the input features, , changes.
- Concept Drift: This is a more fundamental change where the relationship between the input features and the target variable changes. The "meaning" of the data has shifted. Mathematically, the conditional probability distribution, , changes.
Often, these two occur together, but it's crucial to distinguish them to diagnose problems correctly.
-
Metaphor for a 5-Year-Old:
Imagine your model is a spam detector you built last year.- Data Drift: You suddenly start receiving emails written entirely in Japanese. Your model, trained only on English, has never seen these characters before. The type of data it's receiving has drifted.
- Concept Drift: Spammers get smarter. They stop using words like "lottery" and "free money." Instead, they start sending emails that look like urgent password reset requests. The features that once reliably predicted spam (e.g., the word "free") no longer do. The very concept of what a spam email looks like has changed.
-
Anchor Resource & Visualization:
To solidify these definitions, we'll consult two excellent resources from Evidently AI, a company specializing in ML monitoring.
What is data drift in ML, and how to detect and handle it
First, read the brief introductory sections of these two articles to get a clear definition of data drift and concept drift.
In the 'What is data drift?' article, read the sections 'What is data drift?' and 'Data drift vs. Concept drift'.
What is concept drift in ML, and how to detect and address it
In the 'What is concept drift?' article, read the introductory section 'What is concept drift?' for a complementary perspective.
Focus on the core definition and the comparison with data drift and model drift.
The following image provides a perfect visual summary of the difference.

*On the left (Concept Drift), the device type distribution is stable, but what counts as 'Spam' vs. 'Not' changes for each device. On the right (Data Drift), the relationship between device and spamminess is stable, but the distribution of devices itself changes from mostly 'Web' to mostly 'Mobile'.*
2. Quantifying Change: How to Measure Data Drift (Medium)
-
Technical Explanation:
To detect data drift, we statistically compare the distribution of each input feature in a new ("current") dataset against a "reference" dataset (e.g., the training or validation set). Different statistical methods are used for different data types.-
Numerical Features:
- Kolmogorov-Smirnov (K-S) Test: A non-parametric test that compares the cumulative distribution functions (CDFs) of two samples. It's powerful because it doesn't assume the data is normally distributed. The output is a p-value; a small p-value (e.g., < 0.05) suggests the distributions are significantly different.
- Distance Metrics: Instead of a hypothesis test, metrics like Jensen-Shannon (JS) Divergence or Wasserstein Distance quantify how far apart two distributions are. This can be more robust than a p-value, as you can set a threshold on the distance score itself.
-
Categorical Features:
- Chi-Squared Test: This test compares the observed frequencies of categories in the current data against the expected frequencies from the reference data. Like the K-S test, it produces a p-value indicating the significance of the difference.
-
Industry Standard:
- Population Stability Index (PSI): Very popular, especially in finance. It measures how much a variable's distribution has shifted between two periods. It involves binning the variable (even numerical ones), calculating the percentage of observations in each bin for both datasets, and then applying the formula:
A common rule of thumb: PSI < 0.1 means no significant shift, 0.1 <= PSI < 0.25 means a minor shift, and PSI >= 0.25 means a major shift requiring investigation.
- Population Stability Index (PSI): Very popular, especially in finance. It measures how much a variable's distribution has shifted between two periods. It involves binning the variable (even numerical ones), calculating the percentage of observations in each bin for both datasets, and then applying the formula:
-
-
Metaphor for a 5-Year-Old:
You have two big bags of marbles, one from last year (reference) and one from this year (current). To check for "marble drift," you compare them:- K-S Test: You line up the marbles from each bag by size and check if the overall pattern of sizes is different.
- Chi-Squared Test: You count the number of red, blue, and green marbles in each bag and check if the proportions have changed significantly.
- PSI: You sort the marbles into small, medium, and large bins. PSI is a single number that tells you how much the distribution across these bins has changed.
-
Conceptual Python Snippet (Using
evidently):
Theevidentlyopen-source library makes this easy. It takes a reference dataframe and a current dataframe and generates a comprehensive drift report.import pandas as pd from sklearn import datasets from evidently.report import Report from evidently.metric_preset import DataDriftPreset # Load a sample dataset data = datasets.fetch_california_housing(as_frame=True) housing_data = data.frame # --- Create Reference and Current datasets to simulate drift --- # Reference data: The first 3 months (approx) reference_data = housing_data.iloc[:5000] # Current data: The next 3 months, but we'll artificially add drift current_data = housing_data.iloc[5000:10000].copy() # Artificially introduce drift in the 'MedInc' (Median Income) feature current_data['MedInc'] = current_data['MedInc'] * 1.5 # --- Generate the Drift Report --- print("Generating Data Drift Report...") data_drift_report = Report(metrics=[ DataDriftPreset(), ]) data_drift_report.run(reference_data=reference_data, current_data=current_data) # To view the interactive report in a notebook: # data_drift_report # To save as an HTML file: data_drift_report.save_html("data_drift_report.html") print("Report saved to data_drift_report.html") # In a real system, you would parse the JSON output of the report # drift_json = data_drift_report.as_dict() # is_drifted = drift_json['metrics'][0]['result']['dataset_drift'] # print(f"Overall dataset drift detected: {is_drifted}")
3. Tracking Relationships: How to Measure Concept Drift (Medium)
-
Technical Explanation:
Concept drift ( changing) is trickier to measure directly. Detection strategies depend on the availability of ground truth labels.-
Direct Method (with timely labels): This is the gold standard. You monitor the model's predictive performance over time.
- For a classifier, you track Accuracy, Precision, Recall, F1-score.
- For a regressor, you track Mean Absolute Error (MAE), Mean Squared Error (RMSE).
A sustained drop in these metrics is the strongest evidence of model degradation, which is often caused by concept drift.
-
Indirect Methods (labels are delayed or unavailable): When you can't get immediate feedback, you must rely on proxy metrics.
- Prediction Drift: Monitor the distribution of your model's outputs. If a loan approval model that historically approved 15% of applications suddenly starts approving 40%, it doesn't mean the model is wrong, but it's a strong signal that the inputs have changed so much that the model's behavior is different. This warrants investigation.
- Target Drift: If labels arrive with a delay (e.g., you predict customer churn, but only know for sure a month later), you can still monitor the distribution of the ground truth target variable itself. If the actual churn rate suddenly doubles, the underlying concept of churn may have changed.
-
-
Metaphor for a 5-Year-Old:
You're a student taking weekly quizzes.- Direct Method: You get your graded quiz back every Friday. If your score drops from 95% to 60% over a few weeks, you know your understanding of the subject (the "concept") is no longer correct.
- Indirect Method (Prediction Drift): You don't get your grades back, but you notice that for the last three quizzes, you've answered "True" to every question. You don't know your score yet, but this change in your answering pattern is a sign that either the questions have changed dramatically or your understanding has gone haywire.
-
Anchor Video:
This video provides a great overview of the different types of drift and the methods for detecting them, both with and without labels.
ML Drift: Identifying Issues Before You Have a Problem
The video 'ML Drift: Identifying Issues Before You Have a Problem' explains the different types of drift and how to detect them. It clearly separates performance monitoring (with labels) from data drift monitoring (without labels).
Watch the segment from 03:27 to 07:18 to review the types of drift (concept, data, label, feature). Then, watch from 08:18 to 12:11, which discusses detection methods. Pay close attention to the distinction between 'Performance Monitoring' (if you have labels) and 'Data Drift Monitoring' (if you don't).
4. The Guardian System: Designing a Model Monitoring Architecture (Hard)
-
Technical Explanation:
A robust monitoring system is an automated pipeline that operationalizes the concepts we've discussed. The architecture typically looks like this:- Production Logging: The model serving endpoint (online or batch) logs every prediction: the input features, the model's prediction, and a unique prediction ID. This data is streamed to a central location like a data lake (S3) or a log-structured message queue (Kafka).
- Ground Truth Join: A separate process joins the prediction logs with ground truth labels as they become available.
- Baseline Creation: A "golden" reference dataset (often the model's test set or a trusted slice of early production data) is used to generate a baseline profile. This profile contains the expected statistical distributions for every feature and prediction, plus baseline performance metrics.
- Monitoring Job: A scheduled job (e.g., an hourly Spark job or a daily Airflow DAG) runs the core analysis:
- It reads a recent window of production data ("current" data).
- It compares the "current" data distributions to the "reference" profile to calculate data drift and prediction drift metrics (like PSI or JS divergence).
- If joined ground truth is available, it calculates current performance metrics.
- Alerting & Dashboarding: The job compares the calculated metrics against predefined thresholds. If a threshold is breached (e.g.,
PSI > 0.25orAccuracy Drop > 5%), it triggers an alert (via PagerDuty, Slack, etc.). All metrics are pushed to a time-series database and visualized on a dashboard (e.g., Grafana, CloudWatch).
-
Metaphor for a 5-Year-Old:
This is the automated quality control system in a cookie factory.- Production Logging: A camera takes a picture of every cookie that comes off the line.
- Baseline Creation: You show the system a picture of a "perfect" cookie. It learns its size, shape, and color.
- Monitoring Job: Every hour, the system analyzes the pictures of the last 1000 cookies.
- Drift Calculation: It checks: Are the cookies suddenly getting smaller (data drift)? Is the machine starting to produce burnt cookies (performance degradation)?
- Alerting: If the cookies are out of spec, an alarm bell rings on the factory floor, and the factory manager gets a text message.
-
Architectural Blueprint:
This diagram illustrates a complete MLOps feedback loop, where monitoring is the critical trigger.
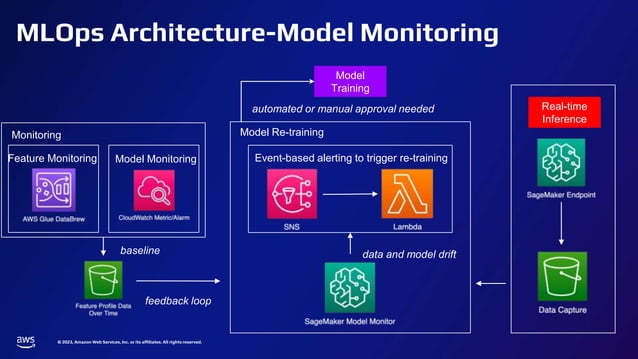
*This AWS architecture shows how a 'SageMaker Model Monitor' continuously compares real-time inference data against a baseline. If drift is detected ('Drift detection'), it triggers an event ('CloudWatch Alarm') that can automatically kick off a model retraining pipeline. This is the blueprint for an automated, self-healing ML system.*
5. From Alert to Action: Remediation Strategies for Drift (Harder)
-
Technical Explanation:
Detecting drift is only half the battle. Responding correctly is what matters. When an alert fires, the response follows a clear decision tree.-
Triage and Analysis:
- Is it a data integrity issue? This is the first question. Check upstream data pipelines. A common cause of "drift" is a bug where a feature pipeline starts sending nulls or garbage values. This is a data quality fire, not model drift.
- Is it genuine drift? If the data is valid, use monitoring dashboards to pinpoint which features have drifted and how. This context is vital.
-
Remediation Actions:
- Model Retraining: This is the most common response to genuine drift. You update the model with new data that reflects the new reality. Retraining isn't a single strategy; you must choose:
- Full Retrain: Combine old and new data.
- Incremental Update: Use only the most recent data (best for sudden, permanent changes).
- Weighted Training: Combine data but assign higher weights to recent samples.
- Process Intervention (when retraining isn't an option): Sometimes you can't retrain immediately (e.g., no new labels, volatile environment). In these cases:
- Adjust Decision Thresholds: If a fraud model is generating too many false positives due to drift, you can raise the prediction threshold required to flag a transaction, making it more conservative.
- Fallback to a Simpler Model: Switch to a heuristic or rule-based system that is more robust, albeit less accurate.
- Human-in-the-Loop: Route high-uncertainty predictions to a human expert for manual review.
- Turn Off the Model: In extreme cases, if the model is causing more harm than good, disable it.
- Model Retraining: This is the most common response to genuine drift. You update the model with new data that reflects the new reality. Retraining isn't a single strategy; you must choose:
-
-
Metaphor for a 5-Year-Old:
The smoke alarm in your house goes off.- Triage: First, you check if it's just burnt toast (a data quality bug) or a real fire (genuine drift).
- Retraining: If there's a new type of fire hazard you hadn't anticipated (e.g., a new electronic device is overheating), you update your family's fire escape plan and practice it (retrain the model).
- Process Intervention: If there's a real fire you can't control, your immediate action is to get everyone out of the house using the escape route you already know (fallback/human-in-the-loop). You don't stop to write a new plan in the middle of a fire.
-
Anchor Video (Practical Demonstration):
This tutorial showcases how model performance degrades over time with new data and how a monitoring tool makes this degradation visible, setting the stage for remediation.
Evidently AI Tutorial-Open Source ML Models Monitoring and Observability
The 'Evidently AI Tutorial' by Krish Naik is a fantastic practical walkthrough. It shows exactly how a model's performance metrics decay when new weekly data is introduced, highlighting the need for remediation.
Watch the following segments: First, 11:07 - 20:15, where an initial model is trained on 'reference' data and a baseline performance report is generated. Then, watch 20:15 - 24:42, where the model is evaluated on new 'current' data (Week 1). Notice how the error metrics (like MAE) increase and the error distribution plots change, indicating degradation. Finally, watch 24:42 - 28:11, where he explicitly checks for 'Target Drift' and 'Data Drift' to diagnose the issue. This demonstrates the full cycle of 'baseline -> monitor -> detect degradation'.
Test your understanding! (System Design Question)
You are the ML Platform lead at an e-commerce company. The team has a product recommendation model that personalizes the homepage for users. A major "Summer Sale" marketing campaign has just launched, heavily promoting a new line of outdoor gear that was not in the model's original training data.
- What specific types of drift do you anticipate seeing in the first few days of the campaign? (Name at least one type of data drift and one type of concept drift).
- How would your automated monitoring system detect these drifts? Mention specific metrics.
- Outline your step-by-step remediation plan after the monitoring system fires an alert.
Show answer
Here's a breakdown of the situation:
1. Anticipated Drift:
- Data Drift:
- Categorical Feature Drift: The
product_categoryfeature will see a significant shift. The distribution will change, with the new "outdoor gear" category appearing as a new value or its frequency spiking dramatically. - Numerical Feature Drift: User behavior features like
session_durationornum_items_viewedmight increase as users, drawn by the sale, engage more with the site.
- Categorical Feature Drift: The
- Concept Drift:
- The relationship between user features and
product_clicked(the target) will change. A user who previously only bought electronics might now be interested in a tent due to the sale's promotion. The model's learned rule "users who buy laptops also look at monitors" is now less relevant; the new rule might be "everyone is looking at tents."
- The relationship between user features and
2. Detection by the Monitoring System:
- Data Drift Detection:
- The monitoring job would compare the distribution of
product_categoryfrom the last hour against the reference baseline. It would use a Chi-Squared test, which would return a very low p-value, triggering aData Driftalert. - For
session_duration, it would use a K-S test or calculate the PSI. A PSI value well above 0.25 would trigger an alert.
- The monitoring job would compare the distribution of
- Concept Drift Detection:
- Directly (Performance): The Click-Through Rate (CTR) on recommendations would likely drop. The model, unaware of the new popular items, will keep recommending old products, which users will ignore in favor of the sale items. The monitoring system would detect this drop in the
precisionorrecall@kof the recommendation model, triggering aPerformance Degradationalert. - Indirectly (Prediction Drift): The model's output distribution might not change much initially (it will keep predicting the old categories), but the ground truth distribution of what users actually click (
Target Drift) will shift massively towards outdoor gear. The discrepancy between prediction distribution and target distribution is a key sign of concept drift.
- Directly (Performance): The Click-Through Rate (CTR) on recommendations would likely drop. The model, unaware of the new popular items, will keep recommending old products, which users will ignore in favor of the sale items. The monitoring system would detect this drop in the
3. Step-by-Step Remediation Plan:
- Acknowledge Alert & Triage: The on-call engineer sees the alerts for
Data Driftonproduct_categoryandPerformance Degradationon recommendation CTR. - Investigate, Don't Blindly Retrain: The first step is to check dashboards. The engineer confirms the drift is due to the "Summer Sale" campaign, not a data pipeline bug. This is expected, legitimate drift.
- Short-term Mitigation (Process Intervention): Retraining a large recommendation model might take hours. We need an immediate fix. The team can deploy a fallback rule: temporarily boost the score of all "outdoor gear" products or even create a rule to place a banner for the sale items at the top of the recommendations for all users. This patches the user experience while a proper fix is prepared.
- Trigger Model Retraining: The engineer triggers the retraining pipeline. The key decision here is the data selection. The best strategy would be to use data from the last 24-48 hours (the start of the sale) to ensure the model learns the new user intent and becomes aware of the new products. Simply retraining on all historical data would dilute the new, important signal.
- Evaluate and Deploy New Model: The newly trained model is evaluated on a holdout set of recent data. If its performance is better than the old model, it's deployed, likely using a canary release to minimize risk.
- Update Baseline: Once the new model is stable in production, a new monitoring baseline should be captured from the current data. The "new normal" includes the outdoor gear, and the system should now monitor for deviations from this new baseline.
Conclusion
Today, we've built a complete mental model for ensuring ML systems remain valuable after deployment. You now understand that models are not static; they exist in a dynamic world and are subject to constant change.
Key Takeaways:
- Model degradation is inevitable and is primarily caused by data drift (input distributions change) and concept drift (input-output relationships change).
- Data drift is measured with statistical tests (K-S test, Chi-Squared) and distance metrics (PSI, JS Divergence) by comparing current data to a reference baseline.
- Concept drift is best measured by a drop in model performance metrics (e.g., accuracy, MAE), but can also be inferred from prediction drift when labels are unavailable.
- A monitoring system is an automated MLOps pipeline that logs data, runs scheduled analyses, calculates drift and performance, and triggers alerts.
- Responding to drift is a structured process: first analyze to rule out data quality bugs, then remediate by either retraining the model or applying a short-term process intervention.
Next Lesson Preview
We've discussed how retraining a model is a key response to drift. But once you have a new model candidate, how do you safely deploy it and scientifically prove it's better than the current one in the real world? In our next lesson, we will cover exactly that: Implement A/B testing and canary deployment strategies for comparing ML models in production.