Hello! Welcome to the final lesson in our module on monitoring and troubleshooting distributed applications.
In our last lesson, you learned how to configure Azure Monitor to proactively notify you of issues by creating alert rules from both metrics and KQL log queries. This is a vital skill for maintaining application health.
Today, we'll complete our monitoring toolkit by addressing the learning outcome: Use the Application Map in Azure Monitor to visualize dependencies and identify performance bottlenecks in a distributed system. While alerts tell you that a problem occurred, the Application Map shows you where it happened within your application's architecture. It provides a living diagram of your system, making it an indispensable tool for debugging complex, multi-component applications.
1. What is Application Map?
Imagine trying to understand the connections between dozens of microservices, databases, and queues just by looking at code or configuration files. It would be incredibly difficult. The Application Map solves this by automatically generating a visual topology of your distributed application.
To begin, let's get a formal introduction from the official documentation.
Application map: Triage distributed applications
This Microsoft Learn article introduces the Application Map, explaining its purpose and the key visual elements you'll be working with. It defines what constitutes a 'component' in the map.
Please read the introduction and the 'Understand components' section. Focus on how the map represents components as nodes and HTTP calls as connectors (edges), and how it displays health KPIs like performance and failures.
As the reading describes, the map consists of:
- Nodes: These are the circles on the map, representing independently deployable parts of your application (like a web app, an API, or an Azure Function) or its external dependencies (like a SQL database or a third-party API).
- Connectors (or Edges): These are the lines between nodes, representing calls (usually HTTP) between components. They show the direction of the call and are annotated with performance data.

2. The Technology Behind the Map
The Application Map isn't magic; it's built on two core technical concepts that are automatically handled by the Application Insights SDK. Given your background in application development, understanding these mechanisms will be very insightful.
-
Distributed Tracing: To connect a call from
Service AtoService B, Application Insights needs to know that the requestService Breceived was initiated byService A. The SDK achieves this by injecting special HTTP headers (part of the W3C Trace Context standard, liketraceparent) into outgoing requests. WhenService B(also instrumented with the SDK) receives this request, it reads the header and includes this correlation information in its own telemetry. This allows Application Insights to stitch together the end-to-end transaction. -
Cloud Role Name: If you have multiple services (e.g.,
order-service,payment-service) sending telemetry to the same Application Insights instance, how does the map know to draw them as separate nodes? The answer is thecloud_RoleNameproperty. This is the most critical configuration for a useful Application Map. Each distinct service must have a uniquecloud_RoleName. If they are all the same (or not set), Application Insights will lump them all into a single node.
The following resource provides excellent code examples for setting this essential property.
How to Use Azure App Insights App Map to Visualize Microservice Dependencies
This article from OneUptime gives a practical overview of setting up Application Map, with a focus on the prerequisites. We will focus on the 'Setting Up Cloud Role Names' section.
Read the sections 'Prerequisites' and 'Setting Up Cloud Role Names'. Pay close attention to the C# code snippet for setting the cloud_RoleName using a TelemetryInitializer. This is the standard pattern you would implement in your .NET applications.
As you saw in the C# example, you can create a simple ITelemetryInitializer to set the RoleName for all telemetry coming from that specific service. This is a powerful and clean way to ensure your components are correctly identified.
3. Using the Map to Diagnose Issues
Now that you understand the "what" and "how," let's focus on the "why": using the map to find problems. The map is your first stop when investigating performance degradation or failures in a distributed system.
The best way to learn this is to see it in action. The following video demonstrates building a multi-component application and then using the Application Map to visualize it and debug a failure.
Azure Application Insights Tutorial | Amazing telemetry service
This tutorial from Adam Marczak is an excellent end-to-end demonstration. It shows how the map is constructed as new services are added and, crucially, how to use it to investigate failures.
Please watch the following segments: Building the Map (17:55 - 19:01, 23:05 - 23:46, 25:48 - 26:50): Observe how the map starts with a single web app and then grows to include a client, a function app, and external dependencies like Queue and Blob storage. This shows the visualization of dependencies. Investigating a Failure (27:40 - 29:55): This is the most critical part. Watch how a failure is introduced and then diagnosed. Notice the red indicators on the map, and how clicking through leads from the high-level component to the specific exception and even the problematic line of code. Investigating Performance (30:06 - 30:47): Briefly watch this section to see how you can use the map and the associated Performance tab to find slow requests, which helps in identifying bottlenecks.
The key takeaways from the video are:
- Visual Indicators: The map uses color (red for failures) and icons to draw your attention to problem areas.
- KPIs at a Glance: Each node and connector displays key metrics: call count, average duration, and failure percentage. A high average duration on a connector is a clear sign of a performance bottleneck.
- Drill-Down Capability: The map is interactive. Clicking on any element opens a detailed pane, allowing you to "Investigate Failures" or "Investigate Performance." This takes you to the same Failures and Performance blades you've seen before, but pre-filtered to the context of the selected component or dependency.
- End-to-End Trace: The ability to see the entire transaction, from the initial client request through multiple backend services to the final dependency call, is incredibly powerful for understanding system behavior and locating the root cause of an issue.
4. Scenario-Based Exercise
Since your current setup only has a single App Service, we'll do a scenario-based exercise to practice interpreting a more complex map.
Examine the Application Map below. It shows an application named fabrikamprod with several dependencies. Imagine you are the on-call developer responsible for this application.
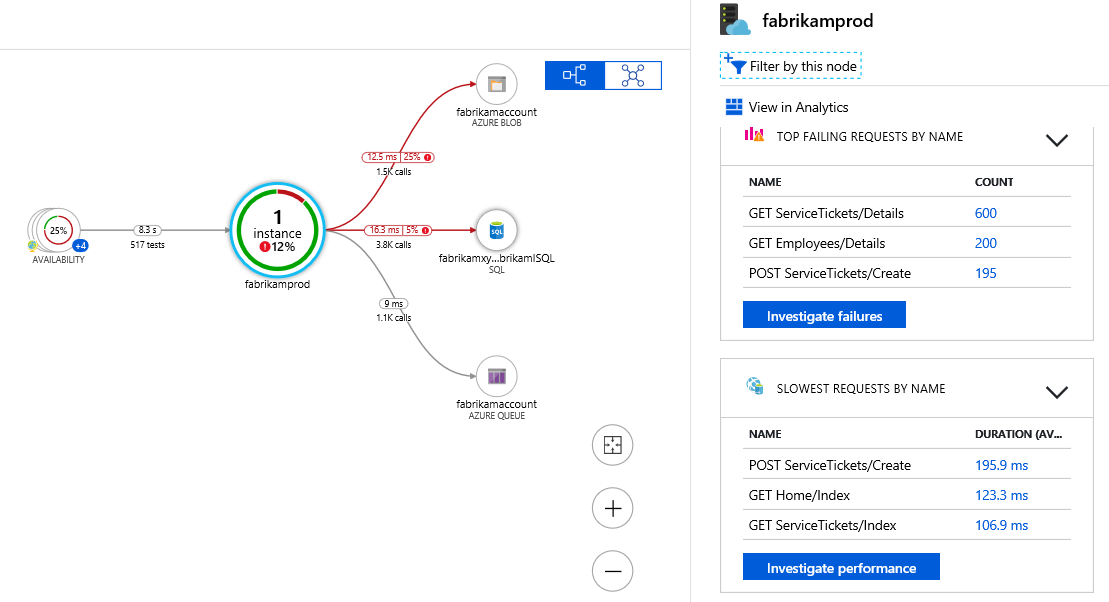
Answer the following questions based on the map:
- Initial Triage: Looking at the central
fabrikamprodnode, what two pieces of information immediately tell you there is a problem with the application's health? - Identifying a Bottleneck: A user reports that "the site feels slow." Based on the detailed pane on the right, which specific operation would you investigate first as a potential performance bottleneck, and what is its average duration?
- Investigating Failures: You need to investigate the failures.
- What is the top failing request by name?
- If you clicked the Investigate failures button, where would you expect to be taken in the Azure portal?
- Dependency Analysis: The connector between
fabrikamprodand the Azure SQL database shows an average duration of124.6 msfor 16 calls. If this number were to suddenly jump to2500 ms, what would be your primary hypothesis about the root cause?
Click to see the answers
- The
fabrikamprodnode shows "25% availability (517 tests)" and "12% failures (1 of 1 instance)". Both the low availability and the non-zero failure rate are immediate indicators of a problem. - The slowest request listed is
GET /FabrikamProd/with an average duration of 934 ms. This is nearly one second and would be the first place to look for performance issues. - The top failing request is
GET /FabrikamProd/Account/SignIn. Clicking Investigate failures would take you to the Failures blade within Application Insights, pre-filtered to show the exceptions and failed dependencies related to thefabrikamprodcomponent. - A sudden, large increase in the average duration of calls to the SQL database strongly suggests a database-related problem. The hypothesis would be either a slow-running query, database resource contention (high DTU/CPU), or a network issue between the app and the database.
Conclusion
Congratulations on completing the module on monitoring! You have built a solid foundation, from instrumenting your code with Application Insights to querying logs with KQL, setting up alerts, and now visualizing your entire system with the Application Map.
Key Takeaways:
- The Application Map provides an auto-generated, visual topology of your distributed application and its dependencies.
- It is essential for quickly identifying failure hotspots (components with high error rates) and performance bottlenecks (dependencies with high latency).
- Correctly configuring the
cloud_RoleNamefor each service is crucial for the map to render correctly. - The map is an interactive diagnostic tool, allowing you to drill down from a high-level view into specific transaction traces and exceptions.
Next Steps
In our next module, we will shift our focus from monitoring to communication. Distributed systems often need to communicate asynchronously to improve reliability and scalability. The first lesson of Module 11, Implementing Message-Based Solutions, will introduce you to two fundamental Azure services for this purpose. We will start by learning to Compare the features and use cases of Azure Queue Storage and Azure Service Bus. This will set the stage for building more resilient and decoupled application architectures.