Hello! Welcome to your next lesson on monitoring and troubleshooting distributed applications.
In our last session, you gained a powerful new skill: writing Kusto Query Language (KQL) queries to explore and analyze the telemetry data collected by Application Insights. You learned how to filter, project, and aggregate data to find specific events and calculate key performance indicators.
Today, we will build directly on that knowledge to address the learning outcome: Create alert rules in Azure Monitor based on metrics and log queries. Instead of manually running queries to check for problems, you'll learn how to configure Azure to do it for you automatically and notify you when something goes wrong. This is a fundamental practice for maintaining the health and reliability of any cloud application.
1. The Anatomy of an Azure Monitor Alert
At its core, an alert rule in Azure Monitor watches your telemetry data and fires an alert when a specific condition is met. This process involves a few key components.
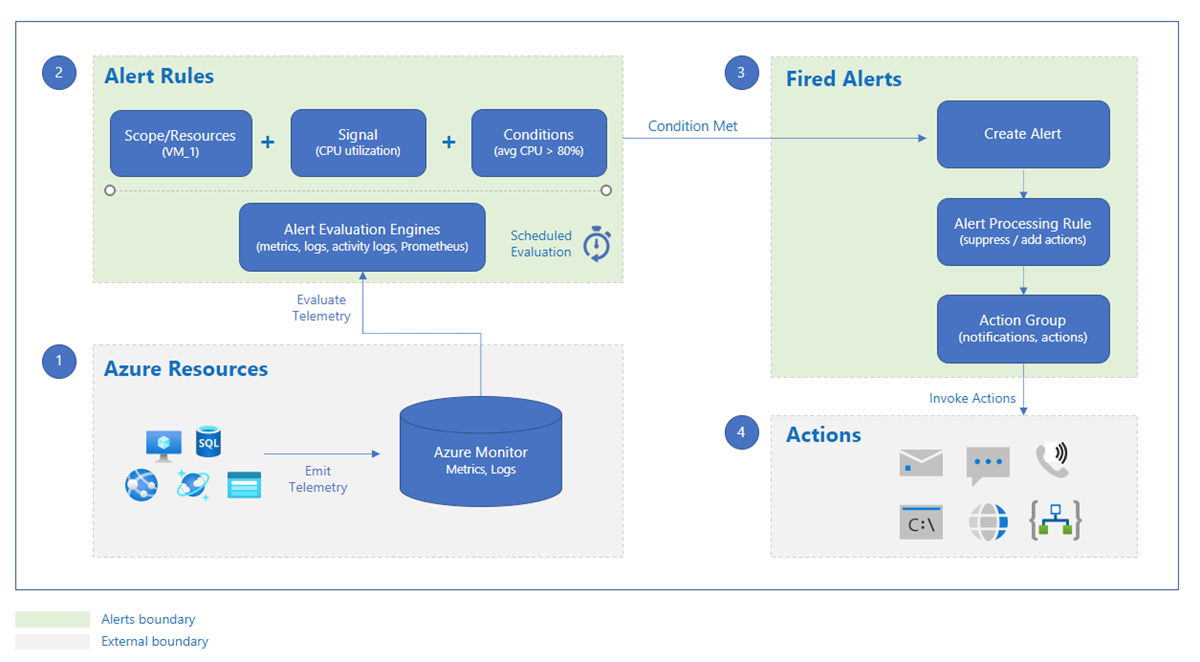
There are two primary types of alert rules you'll work with, and choosing the right one is important:
- Metric Alerts: These are triggered when the value of a specific metric crosses a threshold. They are best for near real-time monitoring of predictable, numeric data like CPU usage, response time, or the number of server errors.
- Log Alerts: These are triggered based on the results of a KQL query that runs on a schedule against your Log Analytics data. They are incredibly flexible and powerful, allowing you to create alerts for complex conditions, specific error text, or patterns that aren't captured by a single metric.
The table below provides a clear comparison of their features.
For the rest of this lesson, we will create one of each type.
2. Creating a Metric Alert
Let's start with the more straightforward type: a metric alert. We'll set up a rule to notify us if our web application starts generating too many server-side errors. This is a classic use case for metric alerts.
The process involves four main steps: defining the scope (what resource to monitor), the condition (what to look for), the actions (what to do when the alert fires), and the details (naming and describing the rule).
Tutorial - Create a metric alert for an Azure resource
This Microsoft Learn tutorial provides a complete walkthrough of creating a metric alert. We will follow its structure for our first exercise.
Please read the following sections to get familiar with the process: Create new alert rule: This shows how to start from the Metrics explorer. Configure alert logic: This is the core part. Focus on understanding Threshold, Operator, Aggregation type, Check every, and Lookback period. Configure actions: Understand the concept of an Action Group as a reusable set of notifications. Configure details: This covers naming, severity, and other final settings.
Now, let's watch a short video that demonstrates creating the condition and the action group. Seeing it in the portal will help solidify the concepts from the reading.
Configuring Alert and Monitoring for Azure Services
This video from the Azure Training Series demonstrates the process of setting up an alert rule. We'll focus on the condition and action group creation.
Watch the following two clips: Defining the Alert Logic (03:02 - 04:52): Pay attention to how the presenter configures the threshold type (static), operator, aggregation type, and threshold value. This corresponds to the 'Configure alert logic' section you just read. Creating an Action Group (04:52 - 06:14): Observe the creation of an action group and the configuration of an email notification. This is a crucial step to ensure you are notified.
Hands-on Exercise: Create a Server Error Alert (10 minutes)
Now it's your turn. Let's apply what you've learned. You will create a metric alert for the App Service you deployed in Module 2.
- Navigate to your App Service in the Azure portal.
- In the left-hand navigation pane, under Monitoring, select Alerts.
- Click Create > Alert rule.
- The Scope should already be set to your App Service. Proceed to the Condition tab.
- Click See all signals. In the search box, type
Http Server Errorsand select that signal. - Configure the Alert logic as follows:
- Threshold:
Static - Operator:
Greater than - Aggregation type:
Total - Threshold value:
5 - Check every:
1 Minute - Lookback period:
5 Minutes - This logic means: "Alert if the total number of server errors in the last 5 minutes is greater than 5."
- Threshold:
- Click Next: Actions >.
- Click Create action group.
- Basics tab: Select your subscription and resource group. Give the action group a name like
EmailAdmins-AG. The display name can beEmail Admins. - Notifications tab:
- Notification type:
Email/SMS message/Push/Voice - Give it a name, e.g.,
PrimaryAdminEmail. - Check the Email box and enter your email address.
- Click OK, then Review + create, and finally Create.
- Notification type:
- Basics tab: Select your subscription and resource group. Give the action group a name like
- Back on the 'Create an alert rule' page, ensure your new action group is selected.
- Click Next: Details >.
- Configure the details:
- Alert rule name:
High Server Error Count - Severity:
Sev 2 - Warning
- Alert rule name:
- Click Review + create, then Create.
You have now configured proactive monitoring for server-side failures on your web app!
3. Creating a Log Alert
Metric alerts are great, but what if you need to alert on something more specific? For example, what if you want to know when your application returns a specific error message, or when a user from a particular IP address tries and fails to log in multiple times? This is where log alerts shine.
The foundation of a log alert is a KQL query. You write a query that returns rows when the "bad thing" happens, and the alert rule triggers when the number of rows (or a value within them) crosses a threshold.
Tutorial - Create a log search alert for an Azure resource
This Microsoft Learn tutorial explains the process for creating a log alert. Notice how it starts with writing and verifying a KQL query.
Please read these sections to understand the flow: Select a log query: This reinforces that everything starts with a KQL query. Create alert rule: Shows how to launch the alert rule creation wizard from the Logs view. Configure condition: Pay attention to the Measurement section, which defines how the query results are evaluated. Configure alert logic: This covers setting the threshold and evaluation frequency, which directly impacts cost and responsiveness.
The following video provides a concise demonstration of this process, starting from a KQL query and turning it into an active alert rule.
Querying Azure Log Analytics (with KQL)
This clip from Dustin Vannoy demonstrates creating an alert rule directly from a KQL query in the Log Analytics workspace.
Watch from 16:00 to 17:57. The presenter takes an existing query, clicks 'New alert rule', and then configures the condition based on the number of results over a specific time period. This is the exact workflow for creating a log alert.
Hands-on Exercise: Create a 'Not Found' Error Alert (10 minutes)
Let's create a log alert to notify you if your application starts generating an unusual number of 404 Not Found errors. This could indicate broken links or scanning activity.
- Navigate to your Application Insights resource in the Azure portal.
- Under Monitoring, select Logs.
- In the query editor, enter the following KQL query. This query counts the number of requests that resulted in a
404status code over the last 30 minutes.requests | where resultCode == "404" | where timestamp > ago(30m) - Run the query to ensure it works (it will likely return no results, which is fine).
- Click New alert rule.
- On the Condition tab, the query is pre-filled. Configure the Alert logic:
- Measure based on:
Number of results - Operator:
Greater than - Threshold value:
10 - This logic means: "Alert if the query returns more than 10 rows."
- Measure based on:
- Expand the Evaluation section:
- Check every:
5 Minutes - Lookback period:
30 Minutes - This means the query will run every 5 minutes and look at the last 30 minutes of data.
- Check every:
- Click Next: Actions >.
- This time, click Select action groups. Check the box next to the
EmailAdmins-AGyou created earlier and click Select. Reusing action groups is a key efficiency. - Click Next: Details >.
- Configure the details:
- Alert rule name:
Excessive 404 Not Found Errors - Severity:
Sev 3 - Informational
- Alert rule name:
- Click Review + create, then Create.
You have now set up a more sophisticated alert based on a specific log data pattern!
Conclusion
In this lesson, you have learned how to automate the process of monitoring your applications by creating alert rules. You are no longer required to manually check dashboards or run queries; Azure will now proactively inform you of potential issues.
Key Takeaways:
- Metric alerts are ideal for monitoring simple numeric thresholds on a near real-time basis (e.g., CPU > 90%).
- Log alerts provide maximum flexibility by using KQL queries to detect complex patterns, specific events, or business-logic failures within your log data.
- Every alert rule consists of a Scope (what to monitor), a Condition (the trigger), Actions (what to do), and Details (name and severity).
- Action Groups are reusable components that define how you get notified (email, SMS, etc.) and can be linked to multiple alert rules.
Next Steps
You've now explored how to instrument your code, query the resulting telemetry, and create alerts. The final piece of the monitoring puzzle is visualizing how different parts of your distributed system interact. In our next and final lesson of this module, we will explore the Application Map in Azure Monitor to visualize dependencies and identify performance bottlenecks.