Hello! Welcome back to our course on building a production-ready rate limiter.
In the previous module, you did some excellent work building the core infrastructure of our service. You created dynamic configuration parsing, rule-matching logic, and a RateLimiterFactory that can instantiate the correct algorithm on demand. The entire logical pipeline, from an incoming HTTP request to selecting the right rate limiter, is now complete.
But having a working system is only half the battle. A key part of infrastructure engineering is proving that your system is not just correct, but also performant. How fast are our in-memory algorithms? How much overhead does a lock introduce? Does the lock-free token bucket really outperform the synchronized version?
This module is all about answering those questions with data. We'll dive into the world of performance benchmarking to measure, compare, and validate the design choices you've made.
Your learning outcome for this lesson:
You will set up the Java Microbenchmark Harness (JMH) for algorithm performance analysis. We'll get the tool configured in our project, understand the principles of good microbenchmarking, and run our first simple benchmark to see it in action.
1. The Challenge of Accurate Measurement in Java
Before we add any code, it's crucial to understand why we need a specialized tool like JMH. You can't just slap a System.nanoTime() call around a method and expect a reliable result. The Java Virtual Machine (JVM) is an incredibly complex piece of engineering that performs many runtime optimizations, including:
- Just-In-Time (JIT) Compilation: The JVM compiles frequently used "hot" bytecode into highly optimized native machine code. A benchmark that runs before this compilation is complete will measure something very different from what happens in a long-running application.
- Dead Code Elimination (DCE): If the JVM detects that the result of a computation is never used, it might eliminate the computation entirely. A naïve benchmark could end up measuring nothing at all.
- Method Inlining & Loop Unrolling: The JVM can aggressively optimize code by, for example, replacing a method call with the body of the method itself.
JMH, developed by the same engineers who work on the OpenJDK, is designed to handle all these complexities. It provides a framework that warms up the JVM, prevents unwanted optimizations, and runs code in a controlled environment to produce statistically sound performance measurements.
Java JMH Guide: Benchmarking Essentials
To get a solid grasp of these challenges, please read the introduction to this article from Medium.
Read the first three sections: 'Introduction', 'Why Microbenchmarking', and the overview of JMH's features. This will provide the foundational context for why we're using this tool.
2. Setting Up JMH in Your Project
Integrating JMH into a Maven project (which Spring Initializr typically generates) involves two steps: adding dependencies and configuring the Maven Compiler Plugin.
-
Add Dependencies: We need two artifacts:
jmh-core, which contains the benchmarking APIs, andjmh-generator-annprocess, which is an annotation processor that generates the necessary benchmark runner code at compile time. -
Configure the Compiler Plugin: We must tell Maven to use the JMH annotation processor during the compilation phase.
Java JMH Guide: Benchmarking Essentials
The 'Setting Up JMH' section of the same article provides the exact XML snippets you'll need for your pom.xml file.
Please read the section 'Setting Up JMH in Your Java Project', focusing on the 'For Maven Projects' part. Copy the provided <dependencies> and <plugin> blocks into your project's pom.xml file. It's good practice to use the latest version of JMH; you can check the latest on Maven Central, but the version in the article (1.37) is perfectly fine for our purposes.
Best Practice: It's recommended to place benchmark code in the src/test/java directory. This keeps your performance testing code separate from your main application source and ensures it isn't packaged into the final production JAR.
3. Anatomy of a JMH Benchmark
A JMH benchmark is a Java class with specific annotations that tell JMH how to measure your code. Let's break down the fundamental concepts.
Forks, Warmup, and Measurement
When JMH runs, it doesn't just execute your method once. It follows a rigorous process for each benchmark:
- Fork: JMH starts a new, separate JVM process (a "fork") to run the benchmark. This ensures that each benchmark run is isolated from others.
- Warmup: Within a fork, JMH runs your code for a number of "warmup" iterations. The results of these runs are discarded. Their only purpose is to allow the JVM to perform its JIT compilation and other optimizations, so that the code reaches a stable performance state.
- Measurement: After warming up, JMH runs "measurement" iterations. The performance data from these runs is collected and used to calculate the final score.
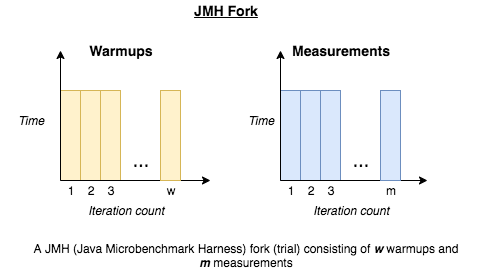
Core Annotations
You control this process using annotations. Here are the most important ones to start with:
@Benchmark: Marks a method as a performance benchmark.@BenchmarkMode: Specifies what to measure. Common modes are:Mode.Throughput: Measures operations per unit of time (e.g., ops/second). This will be very useful for us.Mode.AverageTime: Measures the average time it takes for one operation (e.g., nanoseconds/op).
@OutputTimeUnit: Sets the time unit for the results (e.g.,TimeUnit.NANOSECONDSorTimeUnit.SECONDS).@State: Defines a state object. JMH manages the lifecycle of this object. Using a state object is the correct way to initialize data that your benchmark will use. TheScopedetermines how the state is shared (e.g.,Scope.Benchmarkfor all threads,Scope.Threadfor per-thread state).@Setupand@TearDown: Methods within a@Stateclass to initialize and clean up the state before/after benchmark runs.@Fork,@Warmup,@Measurement: These allow you to override the default number of forks, warmup iterations, and measurement iterations.
Performance Analysis using JMH
The article 'Performance Analysis using JMH' gives a great tour of these annotations with clear code examples.
Please read the following sections to see these annotations in context: 'Writing Benchmarks': Pay attention to how @Fork, @Warmup, @Measurement, @BenchmarkMode, and @OutputTimeUnit are used at the class level. 'Benchmark Modes': Review the descriptions of the different modes available. 'State': Read this section carefully. It explains how to use @State, @Setup, and @TearDown, which is the standard pattern for preparing data for your benchmarks.
4. Activity: Your First Benchmark
Theory is great, but let's see this in action. We'll create a very simple benchmark to get comfortable with the workflow before we apply it to our rate limiter. The goal here is just to set up the class, run it, and understand the output.
Step 1: Create the Benchmark Class
In your src/test/java directory, create a new package (e.g., com.example.ratelimiter.benchmark) and add the following Java class.
package com.example.ratelimiter.benchmark;

import org.openjdk.jmh.annotations.*;
import org.openjdk.jmh.infra.Blackhole;
import java.util.concurrent.TimeUnit;

@BenchmarkMode(Mode.AverageTime)
@OutputTimeUnit(TimeUnit.NANOSECONDS)
@State(Scope.Thread)
@Fork(value = 1, jvmArgs = {"-Xms2G", "-Xmx2G"}) // 1 fork, 2GB heap
@Warmup(iterations = 3, time = 1) // 3 warmup iterations of 1 second each
@Measurement(iterations = 5, time = 1) // 5 measurement iterations of 1 second each
public class FirstBenchmark {

    @Param({"10", "100", "1000"})
    private int iterations;

    @Benchmark
    public String stringConcatenation() {
        String result = "";
        for (int i = 0; i < iterations; i++) {
            result += i;
        }
        return result;
    }

    @Benchmark
    public String stringBuilder() {
        StringBuilder sb = new StringBuilder();
        for (int i = 0; i < iterations; i++) {
            sb.append(i);
        }
        return sb.toString();
    }

    // An alternative to returning a value is to use a Blackhole.
    // This reliably prevents dead code elimination.
    @Benchmark
    public void stringBuilderWithBlackhole(Blackhole bh) {
        StringBuilder sb = new StringBuilder();
        for (int i = 0; i < iterations; i++) {
            sb.append(i);
        }
        bh.consume(sb.toString());
    }
}
Step 2: Run the Benchmark
The most reliable way to run JMH benchmarks is from the command line after building the project. This ensures they run in a clean environment, separate from your IDE.
-
Open a terminal in your project's root directory.
-
Build the project, including the test code where your benchmark lives:
mvn clean packageThis will produce a JAR file in your
target/directory. By default, Maven creates a JAR for your application and JMH creates a specialbenchmarks.jarthat contains everything needed to run the tests. -
Run the benchmark:
java -jar target/benchmarks.jar FirstBenchmarkYou can run a specific benchmark by providing its name as an argument.
Step 3: Analyze the Output
After a few minutes, JMH will print a summary table. It will look something like this:
Benchmark                                  (iterations)  Mode  Cnt      Score      Error  Units
FirstBenchmark.stringBuilder                       10  avgt    5      105.231 ±    2.109  ns/op
FirstBenchmark.stringBuilder                      100  avgt    5     1143.513 ±   55.981  ns/op
FirstBenchmark.stringBuilder                     1000  avgt    5    13890.122 ±  211.345  ns/op
FirstBenchmark.stringBuilderWithBlackhole          10  avgt    5      106.877 ±    1.987  ns/op
...
FirstBenchmark.stringConcatenation                 10  avgt    5      320.455 ±   11.890  ns/op
FirstBenchmark.stringConcatenation                100  avgt    5    24567.890 ±  987.123  ns/op
FirstBenchmark.stringConcatenation               1000  avgt    5  2154321.987 ± 5432.123  ns/op
- Benchmark: The name of the method and its parameters (
iterations). - Mode: The mode you chose (
avgtfor AverageTime). - Cnt: The number of measurement iterations (5 in our case).
- Score: The measured performance. Here, it's the average time in nanoseconds for a single call to the method.
- Error: The margin of error, indicating the result's stability.
- Units: The units of the score (
ns/op= nanoseconds per operation).
As expected, you'll see that StringBuilder is significantly faster than simple string concatenation, and the performance gap widens dramatically as the number of iterations increases.
Conclusion
Congratulations! You have successfully set up JMH in your project and run your first benchmark. You now have a powerful, industry-standard tool at your disposal to quantitatively analyze code performance.
Key Takeaways:
- Simple timing loops are unreliable for benchmarking in Java due to complex JVM optimizations.
- JMH is the standard tool for writing correct and reliable microbenchmarks.
- JMH runs benchmarks in isolated forks, using warmup iterations to stabilize the JVM before starting measurement iterations.
- You control benchmarks using annotations like
@Benchmark,@State,@BenchmarkMode, and@Fork. - It's crucial to prevent Dead Code Elimination by either returning a value from your benchmark method or consuming it with a
Blackhole.
Next Steps
Now that you have the tools and understanding, you are ready to apply them to our rate limiter. In the next lesson, you will write a JMH benchmark to compare the throughput of your in-memory implementations under contention. We will use the @Threads annotation to simulate concurrent requests and measure how well your ConcurrentHashMap and AtomicLong-based algorithms perform under pressure.