Hello! Welcome back to our journey of building a production-grade rate limiter.
In the last lesson, you successfully set up the Java Microbenchmark Harness (JMH), configured it in your project, and ran your first benchmark. This gave you a powerful tool for measuring code performance accurately, accounting for the complexities of the JVM.
Now, it's time to apply that tool to the core of our project. We need to go beyond simple examples and measure the performance of the actual rate limiting algorithms you've built. A rate limiter in a real system must handle thousands of concurrent requests. So, the critical question is: how do our algorithms perform under pressure?
This lesson will focus on answering that question. We will write a JMH benchmark specifically designed to measure and compare the throughput of your in-memory implementations when multiple threads are trying to use them simultaneously—a situation known as contention.
Your learning outcome for this lesson:
You will write a JMH benchmark to compare the throughput of in-memory implementations under contention.
1. Understanding Thread Contention
Before we write the code, let's solidify our understanding of contention. In a multi-threaded application like our API server, multiple threads of execution run concurrently. When two or more threads attempt to access the same shared, mutable resource at the same time, they "contend" for it. This resource could be a piece of memory, a database connection, or, in our case, the state of a rate limiter (e.g., a counter, a timestamp, or a map of client data).
High contention can severely degrade performance. Threads may have to wait for a lock to be released or may fail in optimistic update attempts (like a compare-and-swap loop), forcing them to retry. This waiting and retrying is wasted work and reduces the overall throughput of the system.
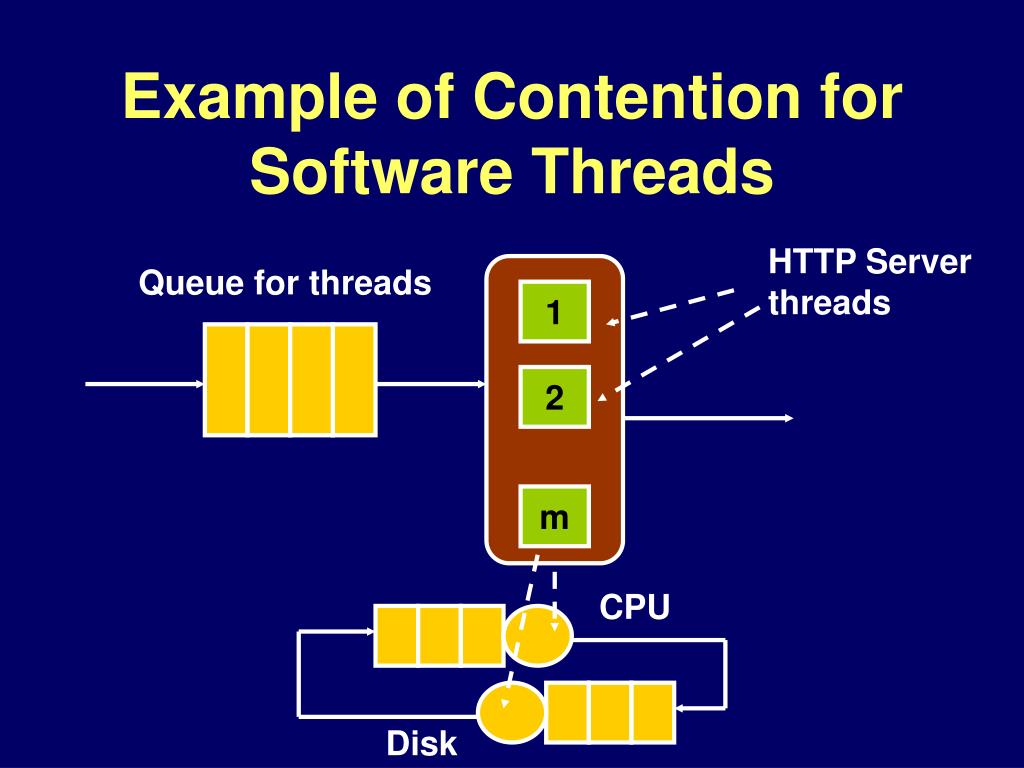
Our goal is to measure how gracefully our different in-memory algorithms handle this pressure.
2. Simulating Contention in JMH with @Threads
In the previous lesson, your benchmarks ran on a single thread. JMH provides a simple but powerful annotation, @Threads, to simulate a multi-threaded workload. By adding @Threads(N) to a benchmark class or method, you instruct JMH to create N threads and have them all execute the benchmark method concurrently.
This is the key to measuring performance under contention. We will use it to see how the throughput of our algorithms changes as we increase the number of competing threads.
Performance Analysis using JMH | The Backend Guy
The following article, 'Performance Analysis using JMH', clearly explains how to enable concurrent execution in your benchmarks. It's a straightforward but fundamental concept for our goal today.
Please read the short section titled 'Concurrent execution'. It introduces the @Threads annotation, which is the main tool we will use to create contention.
3. Setting Up Shared State for Benchmarking
To create contention, all threads must be trying to access the same instance of our rate limiter. If each thread gets its own rate limiter, there's no shared resource and no contention.
In JMH, the standard way to manage shared resources is with a @State object using Scope.Benchmark.
@State(Scope.Benchmark): An object with this scope is instantiated once per benchmark run. All threads participating in that benchmark will share this single instance.
We will create a state class that holds our rate limiter implementations. To make our benchmark flexible and compare different algorithms easily, we can also use the @Param annotation. This tells JMH to run the benchmark multiple times, once for each value in the parameter array.
Microbenchmarking in Java with JMH: Digging Deeper
To see how these concepts fit together in a practical example, let's look at another resource. This article demonstrates setting up shared state and using different implementations within a single benchmark class.
Please review the sections 'Defining Microbenchmark Candidates' and 'Multithreaded Benchmarking'. Pay attention to how they use @State(Scope.Benchmark) to hold a shared object and then combine it with the @Threads annotation in the benchmark method to test multithreaded performance.
4. Activity: Benchmarking Your In-Memory Algorithms
Let's now build the benchmark to test your in-memory algorithms:
- Fixed Window Counter (
ConcurrentHashMap) - Sliding Window Counter (
AtomicLongor similar) - Lock-based Token Bucket (
synchronizedorReentrantLock) - Lock-free Token Bucket (
AtomicLongwith CAS loops)
We will design a single benchmark class that can test all of them across different thread counts.
Step 1: Create the Benchmark Class
In your src/test/java directory, create a new benchmark class. Let's call it InMemoryRateLimiterBenchmark.java.
This class will be a bit more complex than our first one. It will use @Param to select which algorithm to test and another @Param to set the number of concurrent threads. JMH will automatically run the benchmark for every combination of these parameters.
Step 2: Define the State and Setup Logic
We will define a static inner class annotated with @State(Scope.Benchmark). This class will be responsible for creating the correct RateLimiter instance based on the @Param value before the benchmark begins.
Step 3: Write the Benchmark Method
The benchmark method itself will be simple. It will be configured to measure throughput (operations per second). Inside the method, we'll call the tryAcquire() method (or whatever your RateLimiter interface method is named) on the shared instance. We'll use a Blackhole to consume the boolean result to prevent dead code elimination.
Here is a complete template for your benchmark class. You will need to replace the placeholder RateLimiter implementations with your actual classes from previous modules.
package com.example.ratelimiter.benchmark;

import com.example.ratelimiter.inmemory.*; // Import your rate limiter implementations
import org.openjdk.jmh.annotations.*;
import org.openjdk.jmh.infra.Blackhole;

import java.time.Duration;
import java.util.concurrent.TimeUnit;

@BenchmarkMode(Mode.Throughput) // Measure operations per second
@OutputTimeUnit(TimeUnit.SECONDS)
@Fork(value = 1, jvmArgs = {"-Xms2G", "-Xmx2G"})
@Warmup(iterations = 3, time = 2)
@Measurement(iterations = 5, time = 2)
public class InMemoryRateLimiterBenchmark {

    @State(Scope.Benchmark)
    public static class LimiterState {

        // Use @Param to test different algorithms
        @Param({"FIXED_WINDOW", "SLIDING_WINDOW", "TOKEN_BUCKET_LOCK", "TOKEN_BUCKET_LOCK_FREE"})
        private String algorithm;

        public RateLimiter rateLimiter;

        @Setup(Level.Trial)
        public void setup() {
            // This method is called once per trial (for each algorithm)
            // Replace these with your actual implementations
            switch (algorithm) {
                case "FIXED_WINDOW":
                    // Assumes a constructor like: FixedWindowCounter(int capacity, Duration windowSize)
                    rateLimiter = new FixedWindowCounter(1000, Duration.ofSeconds(1));
                    break;
                case "SLIDING_WINDOW":
                    // Assumes a constructor like: SlidingWindowCounter(int capacity, Duration windowSize)
                    rateLimiter = new SlidingWindowCounter(1000, Duration.ofSeconds(1));
                    break;
                case "TOKEN_BUCKET_LOCK":
                    // Assumes a constructor like: LockBasedTokenBucket(int capacity, int refillRate, Duration refillPeriod)
                    rateLimiter = new LockBasedTokenBucket(1000, 1000, Duration.ofSeconds(1));
                    break;
                case "TOKEN_BUCKET_LOCK_FREE":
                    // Assumes a constructor like: LockFreeTokenBucket(int capacity, int refillRate, Duration refillPeriod)
                    rateLimiter = new LockFreeTokenBucket(1000, 1000, Duration.ofSeconds(1));
                    break;
                default:
                    throw new UnsupportedOperationException("Unknown algorithm: " + algorithm);
            }
            System.out.println("--- Setting up benchmark for " + algorithm + " ---");
        }
    }

    // This benchmark runs with a specific number of threads.
    // We can create multiple methods to test different contention levels.
    @Benchmark
    @Threads(1)
    public void test_1_thread(LimiterState state, Blackhole bh) {
        bh.consume(state.rateLimiter.tryAcquire("test-key"));
    }

    @Benchmark
    @Threads(2)
    public void test_2_threads(LimiterState state, Blackhole bh) {
        bh.consume(state.rateLimiter.tryAcquire("test-key"));
    }

    @Benchmark
    @Threads(4)
    public void test_4_threads(LimiterState state, Blackhole bh) {
        bh.consume(state.rateLimiter.tryAcquire("test-key"));
    }

    @Benchmark
    @Threads(8)
    public void test_8_threads(LimiterState state, Blackhole bh) {
        bh.consume(state.rateLimiter.tryAcquire("test-key"));
    }

    @Benchmark
    @Threads(16)
    public void test_16_threads(LimiterState state, Blackhole bh) {
        bh.consume(state.rateLimiter.tryAcquire("test-key"));
    }
}

// NOTE: You will need a common interface for your rate limiters, e.g.:
// public interface RateLimiter {
//     boolean tryAcquire(String key);
// }
Step 4: Run and Analyze
- Place the code above into
InMemoryRateLimiterBenchmark.java. - Crucially, update the
setup()method to instantiate your actual rate limiter classes. Ensure they conform to a commonRateLimiterinterface as suggested in the code comments. - Run the benchmark from your terminal:
mvn clean package
java -jar target/benchmarks.jar InMemoryRateLimiterBenchmark
You will get a result table that looks something like this:
Benchmark                                                (algorithm)  Mode  Cnt      Score   Error  Units
InMemoryRateLimiterBenchmark.test_1_thread              FIXED_WINDOW  thrpt    5  1234567.890 ± ...  ops/s
InMemoryRateLimiterBenchmark.test_1_thread            SLIDING_WINDOW  thrpt    5  1112233.445 ± ...  ops/s
...
InMemoryRateLimiterBenchmark.test_8_threads          TOKEN_BUCKET_LOCK  thrpt    5   543210.987 ± ...  ops/s
InMemoryRateLimiterBenchmark.test_8_threads   TOKEN_BUCKET_LOCK_FREE  thrpt    5  1512345.678 ± ...  ops/s
...
InMemoryRateLimiterBenchmark.test_16_threads              FIXED_WINDOW  thrpt    5   987654.321 ± ...  ops/s
How to Interpret the Results:
- Look at the
Scorecolumn: This is your throughput in operations/second. Higher is better. - Compare algorithms at the same thread count: For
test_8_threads, how doesTOKEN_BUCKET_LOCK_FREEcompare toTOKEN_BUCKET_LOCK? You should expect the lock-free version to have significantly higher throughput. - Observe scaling for a single algorithm: For
TOKEN_BUCKET_LOCK_FREE, how does the score change from 1 thread to 16 threads? Does the throughput increase (good scaling), stay flat, or even decrease (a sign of high contention)? The ideal is near-linear scaling, where 16 threads give close to 16x the throughput of 1 thread, though this is rarely achieved in practice. The performance of the lock-based implementation will likely plateau or degrade quickly as you add more threads.
Conclusion
Excellent work! You have now used JMH to conduct a sophisticated performance analysis of your core algorithms under realistic concurrent conditions. This is a critical skill for any engineer working on backend systems and infrastructure.
Key Takeaways:
- Thread Contention occurs when multiple threads compete for a shared resource, potentially hurting performance.
- The
@Threadsannotation in JMH is used to run benchmarks with multiple concurrent threads. @State(Scope.Benchmark)is essential for creating a shared resource instance that all benchmark threads can access, thereby creating contention.@Paramis a powerful tool for systematically testing different implementations or configurations in a single benchmark run.- Measuring throughput (
Mode.Throughput) is an effective way to quantify how many requests per second an algorithm can handle.
The data from this benchmark provides concrete evidence to back up your design choices. For instance, you can now definitively state that your lock-free token bucket scales better under load than its lock-based counterpart, a key finding for your project portfolio.
Next Steps
While microbenchmarking gives us a precise measure of an algorithm's performance in isolation, it doesn't capture the full picture of a running service. There are other overheads involved: network latency, HTTP request parsing, Spring framework processing, etc.
In the next lesson, we will zoom out from the micro to the macro. You will implement a load test utility using ExecutorService to bombard your running Spring Boot application with concurrent HTTP requests. This will allow us to measure the end-to-end performance of the entire system.