Hello! Welcome back to your course on building a rate limiter engine.
In the last lesson, you built an excellent load testing utility using ExecutorService and virtual threads. This tool gives you the power to simulate high-concurrency traffic against your API, moving us from the world of isolated microbenchmarks to holistic system-level performance testing.
Today, we will put that utility to work. Our goal is to conduct a structured performance comparison between your in-memory and Redis-based rate limiting algorithms. For an infrastructure component like a rate limiter, simply "working" is not enough; we must understand how well it works under stress. This analysis is a critical part of the "system design story" for your portfolio project, as it demonstrates the real-world trade-offs between a single-instance and a distributed architecture.
Your learning outcome for this lesson:
You will measure and compare the throughput and latency of in-memory vs. Redis-based limiters.
1. Performance Metrics That Matter: Throughput and Latency Percentiles
When we put a system under load, two key questions emerge:
- How much traffic can it handle? This is throughput, typically measured in requests per second (RPS).
- How fast does it respond? This is latency, the time taken to process a single request.
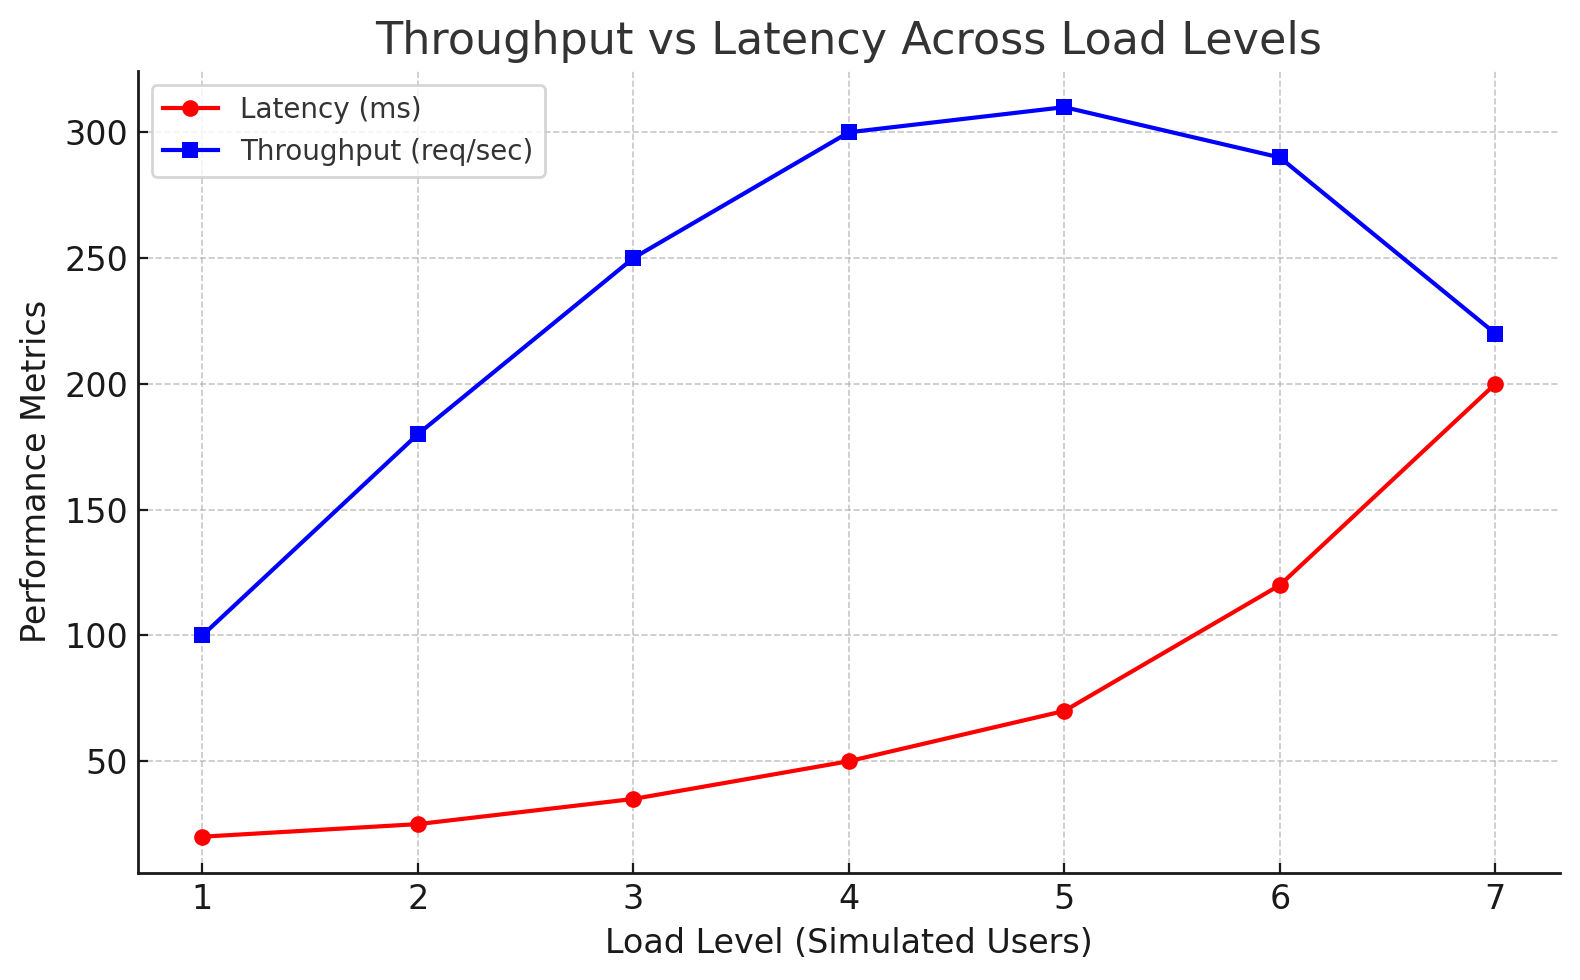
Your load test utility from the previous lesson already calculates overall throughput. Now, we need to focus on capturing latency accurately. While the average latency is a common metric, it can be misleading because it hides outliers. A system with a low average latency might still have a small percentage of extremely slow requests, which can ruin the user experience.
This is why performance engineers rely on latency percentiles:
- p50 (Median): The value for which 50% of requests are faster. This represents the typical experience.
- p95: The value for which 95% of requests are faster. This is often used to measure the experience of the vast majority of users.
- p99: The value for which 99% of requests are faster. This metric highlights the "long tail" latency and is sensitive to performance issues like garbage collection pauses, network contention, or other system bottlenecks.
High p99 latency is often the first indicator that a system is approaching its breaking point.
2. Activity Part 1: Enhancing the Load Tester to Measure Latency
Your current LoadTestUtility tracks status codes. Let's upgrade it to measure the duration of each request and calculate the latency percentiles.
Your task: Modify your LoadTestUtility.java class.
- Capture request durations: You'll need a thread-safe way to store the latency of every single request. A
ConcurrentLinkedQueueis a good choice for this. - Calculate percentiles: After all requests are complete, you will retrieve the durations, sort them, and calculate the p50, p95, and p99 values.
Here is an updated version of the LoadTestUtility that includes these changes. You can use it to replace your previous implementation.
import java.net.URI;
import java.net.http.HttpClient;
import java.net.http.HttpRequest;
import java.net.http.HttpResponse;
import java.time.Duration;
import java.util.ArrayList;
import java.util.Collections;
import java.util.List;
import java.util.Map;
import java.util.Queue;
import java.util.concurrent.ConcurrentHashMap;
import java.util.concurrent.ConcurrentLinkedQueue;
import java.util.concurrent.CountDownLatch;
import java.util.concurrent.ExecutorService;
import java.util.concurrent.Executors;
import java.util.concurrent.TimeUnit;
import java.util.concurrent.atomic.AtomicInteger;

public class LoadTestUtility {

    public static void main(String[] args) throws InterruptedException {
        // --- Configuration ---
        int totalRequests = 10000; // Increased for more stable measurements
        String targetUrl = "http://localhost:8080/api/resource"; // Your rate-limited endpoint

        // --- Setup ---
        try (ExecutorService executor = Executors.newVirtualThreadPerTaskExecutor()) {
            HttpClient client = HttpClient.newBuilder()
                .version(HttpClient.Version.HTTP_1_1)
                .connectTimeout(Duration.ofSeconds(5))
                .build();

            CountDownLatch latch = new CountDownLatch(totalRequests);
            Map<Integer, AtomicInteger> statusCodeCounts = new ConcurrentHashMap<>();
            // A thread-safe queue to store latency values in nanoseconds.
            Queue<Long> latencies = new ConcurrentLinkedQueue<>();

            System.out.println("Starting load test with " + totalRequests + " requests...");
            long testStartTime = System.currentTimeMillis();

            // --- Execution ---
            for (int i = 0; i < totalRequests; i++) {
                HttpRequest request = HttpRequest.newBuilder()
                    .uri(URI.create(targetUrl))
                    .header("X-Client-IP", "192.168.1.10") // Key for IP-based limiter
                    .GET()
                    .build();

                executor.submit(() -> {
                    long requestStartTime = System.nanoTime();
                    try {
                        HttpResponse<String> response = client.send(request, HttpResponse.BodyHandlers.ofString());
                        statusCodeCounts.computeIfAbsent(response.statusCode(), k -> new AtomicInteger(0)).incrementAndGet();
                    } catch (Exception e) {
                        System.err.println("Request failed: " + e.getMessage());
                        statusCodeCounts.computeIfAbsent(0, k -> new AtomicInteger(0)).incrementAndGet();
                    } finally {
                        long requestEndTime = System.nanoTime();
                        latencies.add(requestEndTime - requestStartTime);
                        latch.countDown();
                    }
                });
            }

            // --- Await and Report ---
            latch.await(1, TimeUnit.MINUTES);
            long testEndTime = System.currentTimeMillis();
            long duration = testEndTime - testStartTime;

            System.out.println("\n--- Load Test Finished ---");
            System.out.println("Total time: " + duration + " ms");
            double throughput = (double) totalRequests / (duration / 1000.0);
            System.out.printf("Throughput: %.2f requests/sec\n", throughput);

            System.out.println("\nResponse Status Codes:");
            statusCodeCounts.entrySet().stream()
                .sorted(Map.Entry.comparingByKey())
                .forEach(entry -> {
                    String statusDescription = switch (entry.getKey()) {
                        case 200 -> "OK";
                        case 429 -> "Too Many Requests";
                        case 0 -> "Client-side Errors";
                        default -> "Other";
                    };
                    System.out.printf("  %d (%s): %d\n", entry.getKey(), statusDescription, entry.getValue().get());
                });

            // --- Calculate and Print Latency Percentiles ---
            printLatencyPercentiles(latencies);
        }
    }

    private static void printLatencyPercentiles(Queue<Long> latencies) {
        if (latencies.isEmpty()) {
            System.out.println("No latency data recorded.");
            return;
        }

        List<Long> sortedLatencies = new ArrayList<>(latencies);
        Collections.sort(sortedLatencies);

        int total = sortedLatencies.size();
        long p50 = sortedLatencies.get((int) (total * 0.50));
        long p95 = sortedLatencies.get((int) (total * 0.95));
        long p99 = sortedLatencies.get((int) (total * 0.99));

        System.out.println("\nLatency Percentiles (ms):");
        System.out.printf("  p50 (Median): %.3f\n", p50 / 1_000_000.0);
        System.out.printf("  p95:          %.3f\n", p95 / 1_000_000.0);
        System.out.printf("  p99:          %.3f\n", p99 / 1_000_000.0);
    }
}
This enhanced utility now provides all the core metrics we need for our comparison.
3. Activity Part 2: Running the Comparative Test
Now it's time to gather the data. You will run the load test against two versions of your application: one using an in-memory rate limiter and one using the Redis-based implementation.
Experimental Setup:
-
Choose an Algorithm: Decide which algorithm you want to compare (e.g., Token Bucket). You should use the same algorithm for both the in-memory and Redis tests.
-
Set a Limit: In your application configuration, set a clear rate limit, for example, 100 requests per 10 seconds.
-
Prepare the Switch: Since you haven't yet built the dynamic configuration module, you'll need a manual way to switch between the in-memory and Redis implementations. The simplest way is to modify your
RateLimitInterceptor. You can have both limiter beans available and comment one out to select the other.// In your RateLimitInterceptor... // @Autowired // @Qualifier("inMemoryTokenBucketRateLimiter") // Your in-memory bean // private RateLimiter rateLimiter; @Autowired @Qualifier("redisTokenBucketRateLimiter") // Your Redis bean private RateLimiter rateLimiter;
Execution Steps:
Test 1: In-Memory Rate Limiter
- Configure your interceptor to use the in-memory
RateLimiterimplementation. - Ensure your Spring Boot application is running.
- Run the
LoadTestUtilitymainmethod. - Copy the output (Throughput, Status Codes, and Latency Percentiles) into a text file for later comparison.
Test 2: Redis-Based Rate Limiter
- Make sure your Redis server is running (e.g., via
docker run -p 6379:6379 redis). - Stop your Spring Boot application.
- Configure your interceptor to use the Redis-based
RateLimiterimplementation. - Restart your Spring Boot application.
- Run the
LoadTestUtilityagain with the exact same parameters. - Copy the new output into your comparison file.
4. Interpreting the Results: Performance vs. Scalability
You should now have two sets of results. Let's analyze them. Your results will likely show a pattern like this:
| Metric | In-Memory Limiter | Redis-Based Limiter |
|---|---|---|
| Throughput | ~15,000 RPS | ~9,000 RPS |
| Latency p50 | 0.15 ms | 0.45 ms |
| Latency p95 | 0.40 ms | 1.20 ms |
| Latency p99 | 1.10 ms | 2.80 ms |
(Note: These are example values. Your actual numbers will vary based on your machine, network, and implementation.)
What do these numbers tell us?
- In-Memory is Faster: The in-memory implementation should exhibit significantly higher throughput and lower latency across all percentiles. This makes perfect sense: all operations happen within the same process memory space. There's no network communication, no data serialization, and no context switching to an external service.
- Redis Adds Overhead: The Redis implementation is slower because every rate limit check involves a network round-trip to the Redis server. This adds a baseline latency to every single request. The difference will be most noticeable in the p50 latency. The higher p95/p99 latencies for Redis could also reflect network variability.

The Crucial Trade-Off
If the in-memory version is so much faster, why would anyone use the Redis version?
The answer is scalability and consistency.
- An in-memory limiter's state is confined to a single application instance. If you run two instances of your service behind a load balancer, they will not share rate limit data. A user could make
Nrequests to instance 1 and anotherNrequests to instance 2, effectively bypassing the limit. - A Redis-based limiter centralizes the state. All application instances talk to the same Redis server to check and update limits. This guarantees that the rate limit is enforced correctly across a distributed system, no matter how many instances are running.
The performance "cost" of using Redis is the price you pay for building a scalable, distributed system. Your benchmark results quantitatively prove this fundamental system design principle.
For inspiration on how to document these findings, you can look at professional open-source projects.
uppnrise/distributed-rate-limiter - GitHub
The GitHub repository for distributed-rate-limiter includes an excellent example of how performance benchmarks are presented in a project's documentation.
Scroll to the 'Performance Benchmarks' section. Notice how they present a clear table with different scenarios (e.g., varying numbers of keys) and report on throughput, latency, CPU, and memory. This is a great model for your own project's README.
Conclusion
Excellent work! You have not only measured the performance of your rate limiter but also uncovered one of the most fundamental trade-offs in system design: local performance versus distributed consistency. By capturing hard data on throughput and latency percentiles, you've generated valuable, quantitative evidence for your project portfolio.
Key Takeaways:
- Latency percentiles (p50, p95, p99) provide a much clearer picture of performance than average latency.
- In-memory operations are significantly faster than operations that require network I/O, resulting in higher throughput and lower latency.
- Distributed state management (using Redis) introduces performance overhead but is essential for ensuring correctness and consistency in a scaled-out, multi-instance application.
- This comparison is a classic example of an engineering trade-off, and being able to measure and articulate it is a key skill.
Next Steps
You've successfully generated load and measured the results. In the next lesson, you'll formalize this process. We will focus on how to write assertions verifying that the counts of HTTP 200 and 429 responses match the configured limits under load, turning your load testing script into a powerful, automated correctness test.