Hello! Welcome back to our final module on observability.
In the last lesson, you did an excellent job instrumenting the rate limiter to track requests on a per-rule basis. We created a dimensional metric, ratelimiter.requests.total, with decision and rule tags and verified its output on the /actuator/prometheus endpoint. That endpoint is specifically designed to be scraped by a Prometheus server.
However, Spring Boot Actuator provides another powerful, more general-purpose endpoint for inspecting metrics directly. This lesson focuses on that endpoint. Your learning outcome is to expose custom metrics via the Spring Boot Actuator /metrics endpoint. We'll explore how it differs from the Prometheus endpoint and how to use it as a powerful diagnostic tool for querying your application's metrics in real-time.
1. Enabling and Exploring the Actuator Endpoints
Before we dive into our custom metric, let's ensure the necessary Actuator endpoints are enabled and understand the landscape. Spring Boot Actuator offers a suite of endpoints for monitoring and managing your application, but for security reasons, most are not exposed by default.
The following video provides a great introduction to enabling Actuator and exposing its endpoints through configuration.
Mastering Spring Boot Actuator: Monitoring & Managing Your Application
This video, 'Mastering Spring Boot Actuator' from CodeSnippet, will walk you through the initial setup. Focus on how the spring-boot-starter-actuator dependency works and how application.properties (or application.yml) is used to control which endpoints are accessible.
Watch the sections that cover adding the Actuator dependency and then exposing all endpoints. The key configuration property to note is management.endpoints.web.exposure.include.
Based on the video, make sure your application.yml file is configured to expose the metrics endpoint. In our previous lessons, we already exposed prometheus, so you just need to add metrics to the list.
# src/main/resources/application.yml
management:
  endpoints:
    web:
      exposure:
        include: health, prometheus, metrics # Ensure 'metrics' is included
  metrics:
    tags:
      application: ${spring.application.name}
With this configuration in place, restart your application. You can now access the root Actuator endpoint at http://localhost:8080/actuator, which should show you a JSON response listing all exposed endpoints, including /metrics.
2. The /metrics Endpoint: A Diagnostic View
While the /actuator/prometheus endpoint provides data formatted for a machine (the Prometheus scraper), the /actuator/metrics endpoint is designed for human-readable diagnostics, returning data in a structured JSON format.
Let's explore its basic functionality.
Metrics Endpoint - Spring Boot Documentation
The official Spring Boot documentation provides the most accurate and concise explanation of the metrics endpoint. This section will be our reference for how to interact with it.
Please read the section titled 'Metrics Endpoint'. It's short but contains all the key information on how to list metrics, view a specific meter, and filter by tags.
Now, let's put that documentation into practice.
Step 1: List All Available Metrics
Navigate to http://localhost:8080/actuator/metrics in your browser.
You will see a JSON response containing a single key, names, with an array of strings. This is the list of all registered metric names in your application, including those from the JVM, your web server (Tomcat), and our custom metric, ratelimiter.requests.total.
Step 2: Drill Down into a Specific Metric
As the documentation explains, you can view details about a specific metric by appending its name to the URL. Let's inspect the custom metric you created in the previous lessons.
Navigate to: http://localhost:8080/actuator/metrics/ratelimiter.requests.total
The response will be a more detailed JSON object. It should look something like this:
{
  "name": "ratelimiter.requests.total",
  "description": null, // We didn't add a description, but we could!
  "baseUnit": null,
  "measurements": [
    {
      "statistic": "COUNT",
      "value": 0.0 // The total count across all tags
    }
  ],
  "availableTags": [
    {
      "tag": "decision",
      "values": [ "denied", "allowed" ]
    },
    {
      "tag": "rule",
      "values": [ "ip_default_rule", "api_key_premium_tier" ] // Example rule names
    },
    {
      "tag": "application",
      "values": [ "rate-limiter" ]
    }
  ]
}
This response is incredibly useful for discovery. The availableTags array tells you exactly which dimensions you can use to filter this metric and what values have been seen for each tag.
3. Advanced Inspection: Filtering by Tags
This is where the /metrics endpoint truly shines as a diagnostic tool. You can dimensionally drill down into your metric using query parameters to isolate specific time series.
The syntax, as noted in the documentation, is ?tag=KEY:VALUE.
Let's try a few queries. Make sure you've sent some requests to your API to generate metric data first, including some that are allowed and some that are denied by different rules.
Query 1: All denied requests
Navigate to: http://localhost:8080/actuator/metrics/ratelimiter.requests.total?tag=decision:denied
The measurements field in the JSON response now shows the COUNT of requests where the decision tag was "denied", summed across all rules.
Query 2: All traffic for a specific rule
Navigate to: http://localhost:8080/actuator/metrics/ratelimiter.requests.total?tag=rule:ip_default_rule
This will show you the total number of requests (both allowed and denied) that were processed by the ip_default_rule.
Query 3: Denied requests for a specific rule
Now let's combine tags.
Navigate to: http://localhost:8080/actuator/metrics/ratelimiter.requests.total?tag=rule:ip_default_rule&tag=decision:denied
This is the most granular query. The response gives you the precise count of requests that were denied specifically by the ip_default_rule. This is an invaluable capability for debugging a live system. For instance, if you notice a spike in 429 errors, a query like this can immediately tell you which rule is responsible.
4. Visualizing the End Goal
While the JSON output of the /metrics endpoint is perfect for diagnostics and automated checks, the ultimate goal of instrumentation is often visualization in a dashboarding tool like Grafana. The metrics you've exposed via Actuator (both /prometheus and /metrics) are the source for such dashboards.
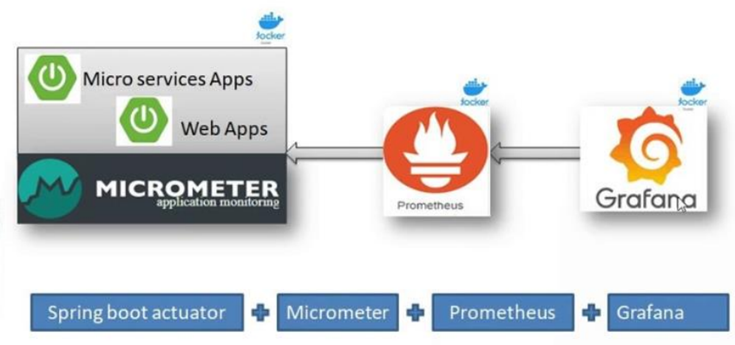
The dimensional metric you built, with its rule and decision tags, allows for the creation of highly informative graphs. You could, for example, build a panel that shows a stacked bar chart of denied requests, broken down by rule.

Conclusion
In this lesson, you learned how to use the Spring Boot Actuator's /metrics endpoint to inspect and diagnose your application's custom metrics. This complements the machine-oriented /prometheus endpoint by providing a human-readable interface for live, ad-hoc analysis.
Key Takeaways:
- The
/actuator/metricsendpoint provides a JSON-based, human-readable view of all Micrometer metrics. - It must be explicitly exposed via the
management.endpoints.web.exposure.includeconfiguration property. - You can list all available metrics by accessing the root
/actuator/metricspath. - You can drill down into a specific metric by appending its name (e.g.,
/actuator/metrics/ratelimiter.requests.total). - The real power lies in filtering by one or more tags using query parameters (
?tag=KEY:VALUE), allowing for precise diagnostic queries.
Next Steps
Your rate limiter is now highly observable. The final steps in making it production-ready involve resilience and client guidance. In our next lesson, we will address a critical system design question: what happens if your Redis instance goes down? You will implement a fallback to an in-memory rate limiter for when Redis is unavailable, ensuring your service remains protected even during a partial outage.