Hello! Welcome back to the final module of our course.
In the last lesson, you successfully instrumented your rate limiter to collect its first custom metric: a counter for the total number of allowed and denied requests. This was a fantastic first step into the world of observability.
However, a simple allowed vs. denied count only tells part of the story. In a system with multiple rate-limiting rules, you don't just need to know that a request was denied; you need to know why. Which specific rule was triggered?
This lesson builds directly on your previous work to answer that question. Your learning outcome is to instrument the rate limiter to track request counts and allowed/denied decisions per rule. We'll achieve this by adding another dimension—or "tag"—to our metric, making it significantly more powerful for debugging and analysis.
1. From Monitoring to Observability with Dimensional Metrics
In our last lesson, we created a metric that tracked two separate time series: one for allowed requests and one for denied requests. This is useful, but its analytical power is limited.
Consider the following dashboard, which is similar to what we built: it shows allowed vs. blocked requests.
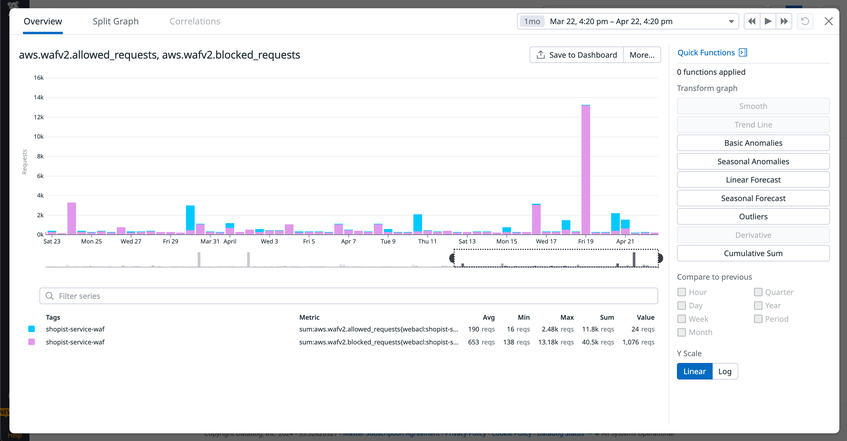
This is great for seeing the overall traffic health. But what if you see a sudden spike in blocked requests? The immediate question is, "Which security rule is causing the spike?" To answer that, you need more detail.
This is where dimensional metrics come in. By adding tags (also called labels or dimensions) to our metrics, we can create rich, multi-dimensional data that can be filtered, grouped, and aggregated. Instead of just decision="denied", we want something like decision="denied", rule="ip_limit".
This is the core of modern observability: instrumenting your code to emit data that lets you ask detailed questions about your system's behavior.
2. Enhancing Your Metric with a "Rule" Tag
Let's enhance the counter we created in the RateLimiterInterceptor. Our goal is to add a tag that identifies which rate-limiting rule was applied to each request.
To do this, we'll assume that your system can identify the specific RateLimitRule object that applies to an incoming request. This rule object, which you designed in Module 8, should have a unique identifier, like a name. Let's assume you have a method rule.getName().
Step 1: Modify the RateLimiterInterceptor
In your preHandle method, after you've determined the decision (isAllowed), you'll also need the name of the rule that was just evaluated. You'll then add this rule name as a second tag to your counter.
// In RateLimiterInterceptor.java

@Override
public boolean preHandle(HttpServletRequest request, HttpServletResponse response, Object handler) throws Exception {
    String key = keyResolver.resolve(request);
    // You have a service to find the rule based on the request/key
    RateLimitRule rule = ruleProviderService.findRule(request);

    // Handle case where no rule is found
    if (rule == null) {
        // We can either allow all requests or deny them.
        // For now, let's assume we allow them but don't track metrics.
        return true;
    }

    RateLimiter rateLimiter = rateLimiterFactory.getRateLimiter(rule);
    boolean isAllowed = rateLimiter.isAllowed(key);

    // --- ENHANCED METRICS INSTRUMENTATION ---
    String decision = isAllowed ? "allowed" : "denied";

    // Now we add a 'rule' tag!
    meterRegistry.counter("ratelimiter.requests.total",
                          "decision", decision,
                          "rule", rule.getName())
                 .increment();
    // ----------------------------------------

    if (isAllowed) {
        return true;
    } else {
        response.setStatus(HttpStatus.TOO_MANY_REQUESTS.value());
        // We'll add the Retry-After header in a future lesson
        return false;
    }
}
Note: I've renamed the metric from ratelimiter.decisions.total to ratelimiter.requests.total to better follow conventions where the name describes what is being counted (requests) and the tags describe the attributes.
The key change is here:meterRegistry.counter("ratelimiter.requests.total", "decision", decision, "rule", rule.getName()).increment();
Micrometer's counter() method accepts a variable number of String arguments for tags, which must always come in key-value pairs. We now have two pairs: ("decision", decision) and ("rule", rule.getName()).
3. A Critical Best Practice: Managing Tag Cardinality
Adding tags is powerful, but it comes with a critical warning: beware of high cardinality. Cardinality refers to the number of unique values a tag can have.
- Low Cardinality (Good):
decision(allowed,denied),http_method(GET,POST), or our newruletag (since you have a finite number of rules in your YAML configuration). - High Cardinality (Bad):
user_id,request_id,ip_address. Using these as tags would create a new time series for every single user or request. This can overwhelm your monitoring system, leading to poor performance and high costs.
The following resource explains this problem clearly.
How to Create Application Metrics - OneUptime
This article from OneUptime provides excellent guidance on designing effective metrics. We'll focus on a critical best practice to avoid performance issues and high costs in monitoring systems.
Please read the section titled 'Avoiding Common Pitfalls', focusing specifically on 'High Cardinality Labels'. This explains why choosing the right tags is just as important as creating the metric itself.
Our rule tag is a perfect example of a good, low-cardinality dimension, as it's tied to your static configuration.
4. Refactoring for Cleaner Code: A Dedicated Metrics Component
Your RateLimiterInterceptor is starting to accumulate responsibilities: it coordinates key resolution, rule selection, rate limiting, and now metrics instrumentation. To adhere to the Single Responsibility Principle, it's a good practice to move the instrumentation logic into its own dedicated component.
We will create a RateLimiterMetrics component that encapsulates all interaction with the MeterRegistry.
Java: Adding custom metrics to Spring Boot Micrometer Prometheus ...
To keep our code clean and maintainable, we'll create a dedicated component for handling metrics. This article demonstrates this exact pattern.
Read the section 'Add metric from custom class'. This shows how to create a separate @Component to manage metrics, which is a much cleaner design than putting instrumentation logic directly in our interceptor.
Let's apply this pattern.
Step 1: Create RateLimiterMetrics Component
Create a new Java class. This class will be injected with the MeterRegistry and will provide a simple method to record the rate limiter's decision.
// src/main/java/.../metrics/RateLimiterMetrics.java
package com.example.ratelimiter.metrics;

import io.micrometer.core.instrument.MeterRegistry;
import org.springframework.stereotype.Component;

@Component
public class RateLimiterMetrics {

    private final MeterRegistry meterRegistry;

    public RateLimiterMetrics(MeterRegistry meterRegistry) {
        this.meterRegistry = meterRegistry;
    }

    public void recordRequest(String ruleName, boolean allowed) {
        String decision = allowed ? "allowed" : "denied";

        meterRegistry.counter("ratelimiter.requests.total",
                              "decision", decision,
                              "rule", ruleName)
                     .increment();
    }
}
Step 2: Refactor RateLimiterInterceptor
Now, refactor the interceptor to use this new component. It no longer needs a direct dependency on MeterRegistry.
// In RateLimiterInterceptor.java
import com.example.ratelimiter.metrics.RateLimiterMetrics; // Import the new class

@Component
public class RateLimiterInterceptor implements HandlerInterceptor {

    //... other fields
    private final RateLimiterMetrics metrics; // Add this

    public RateLimiterInterceptor(RateLimiterFactory rateLimiterFactory,
                                  RateLimitKeyResolver keyResolver,
                                  RateLimitRuleProviderService ruleProviderService,
                                  RateLimiterMetrics metrics) { // Inject it
        this.rateLimiterFactory = rateLimiterFactory;
        this.keyResolver = keyResolver;
        this.ruleProviderService = ruleProviderService;
        this.metrics = metrics; // Store it
    }

    @Override
    public boolean preHandle(HttpServletRequest request, HttpServletResponse response, Object handler) throws Exception {
        // ... logic to get key and rule ...
        RateLimitRule rule = ruleProviderService.findRule(request);
        if (rule == null) {
            return true;
        }

        RateLimiter rateLimiter = rateLimiterFactory.getRateLimiter(rule);
        boolean isAllowed = rateLimiter.isAllowed(key);

        // --- REFACTORED METRICS CALL ---
        metrics.recordRequest(rule.getName(), isAllowed);
        // -------------------------------

        if (isAllowed) {
            return true;
        } else {
            response.setStatus(HttpStatus.TOO_MANY_REQUESTS.value());
            return false;
        }
    }
}
This design is much cleaner. The interceptor's preHandle method now clearly expresses its intent without getting bogged down in the details of how metrics are created.
5. Verification
Let's verify our new, more powerful metric.
- Run your Spring Boot application.
- Send requests that will be handled by different rate-limiting rules. For example, if you have one rule for IP addresses and another for a specific API key, send requests that trigger both. Make sure to exceed the limit for at least one rule.
- Open your browser and navigate to
http://localhost:8080/actuator/prometheus.
Search for ratelimiter_requests_total. You should now see multiple lines, each representing a unique combination of decision and rule tags.
# HELP ratelimiter_requests_total_total
# TYPE ratelimiter_requests_total_total counter
ratelimiter_requests_total_total{application="rate-limiter",decision="allowed",rule="ip_default_rule",} 10.0
ratelimiter_requests_total_total{application="rate-limiter",decision="denied",rule="ip_default_rule",} 5.0
ratelimiter_requests_total_total{application="rate-limiter",decision="allowed",rule="api_key_premium_tier",} 25.0
This output confirms that you are now successfully tracking decisions on a per-rule basis, giving you the granular insight needed to operate this service in production.
Conclusion
In this lesson, you elevated your application's observability from basic monitoring to a more sophisticated, dimensional approach. You can now dissect the behavior of your rate limiter not just by outcome (allowed/denied), but by the specific logic (rule) that led to that outcome.
Key Takeaways:
- Dimensional metrics are created by adding tags to a metric, enabling powerful filtering and grouping.
- The cardinality of tag values must be managed carefully; use tags with a finite, small set of values.
- Refactoring instrumentation logic into a dedicated component (
RateLimiterMetrics) improves code clarity and maintainability. - A metric like
ratelimiter.requests.total{decision="..",rule="..."}provides deep, actionable insights into your system's behavior.
Next Steps
So far, we have focused on the /actuator/prometheus endpoint, which is designed to be scraped by a Prometheus server. However, Spring Boot Actuator also provides a generic /actuator/metrics endpoint. In the next lesson, we will explore the /metrics endpoint, see how it presents data in a different format (JSON), and learn how to query it to inspect specific metrics directly.