Hello! Welcome back to our course on Computerized Accounting.
In our previous lesson, we established the fundamental data types that you can enter into a single spreadsheet cell: labels (text), values (numbers), and formulas (calculations). This was the first step in understanding how spreadsheets handle information.
Today, we'll build on that by learning how to work with groups of cells. This is essential for almost any practical task in accounting, from summing a list of transactions to creating a chart. This lesson addresses the second learning outcome in our "Spreadsheet Essentials" module.
By the end of this lesson, you will be able to: Explain how cell ranges are defined and used in spreadsheet operations.
1. From a Single Cell to a Range of Cells
Imagine you have a column with 50 different expense amounts. In the last lesson, we saw you could add two of them with a formula like =A2+A3. But what if you need to add all 50? Writing =A2+A3+A4+...+A51 would be slow and prone to errors. Spreadsheets provide a much more powerful way to handle this: using a cell range.
A cell range is simply a group or block of selected cells in a worksheet.
Let's start with a clear visual definition.
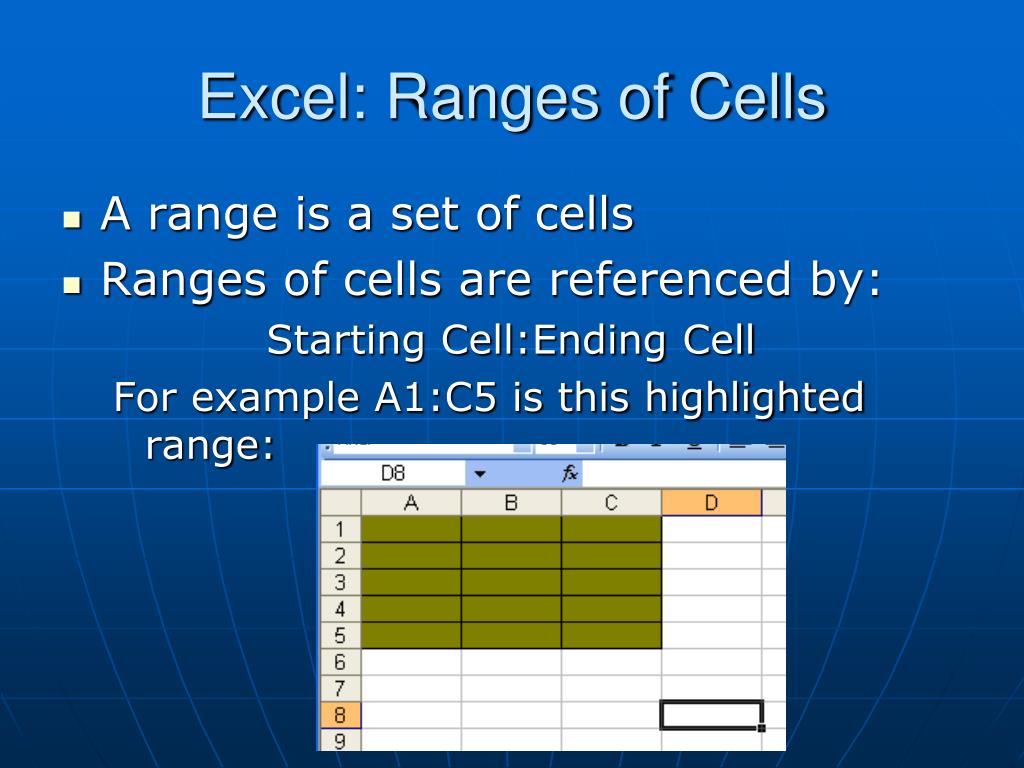
To hear this concept explained, the following video provides a very clear and concise walkthrough of the basic spreadsheet structure, leading up to the definition of a range.
Excel for Beginners - The Complete Course
This video from Technology for Teachers and Students will quickly reinforce your understanding of columns, rows, and cells before introducing the concept of a range.
Watch from 01:26 to 03:27. Pay close attention to how the presenter describes a range as a collection of cells and explains the notation using the upper-left and lower-right cells (e.g., D4 through J14).
2. How to Define a Range: The Notation
As you saw in the video and image, a continuous range is defined by the address of the cell in its top-left corner and the cell in its bottom-right corner, separated by a colon (:).
A1:A10refers to the first 10 cells in column A.B2:E2refers to four cells in row 2, from column B to column E.B2:E10refers to a rectangular block of cells, 36 cells in total (4 columns wide and 9 rows high).
Now, let's explore how to select ranges and introduce a new concept: non-adjacent ranges.
The following text from the 'SPREADSHEETS' PDF explains the practical steps for selecting ranges and makes an important distinction between adjacent and non-adjacent ranges.
Please read section '5.27.2 Working with Cell Ranges'. Focus on: The definition of a range as a 'group or block of cells'. The difference between 'adjacent' and 'non-adjacent' cells. The method for selecting each type (dragging for adjacent, using the Ctrl key for non-adjacent).
To summarize the key methods from that reading:
- Adjacent Range: A single, unbroken block of cells. You select this by clicking the first cell and dragging your mouse to the last cell.
- Non-adjacent Range: Consists of two or more separate cells or blocks. You select this by selecting the first cell/block, then holding down the
Ctrlkey while you click on other cells or drag to select other blocks. The notation for this typically uses a comma, e.g.,(A1:A5, D1:D5).
3. Using Cell Ranges in Operations
Defining a range is only useful if you can do something with it. The primary use of ranges is to perform operations—most commonly, within formulas and functions.
Think back to our problem of adding 50 expenses in cells A2 to A51. Instead of adding them one by one, you can use the SUM function with a cell range:
=SUM(A2:A51)
This single instruction tells Excel to add up every value within that range. This is the core power of using ranges: efficiency and accuracy.
You can use ranges for:
- Calculations:
AVERAGE(B2:B20),MAX(C1:C50) - Creating Charts: Selecting a range of data to be visualized as a bar chart or pie chart.
- Applying Formatting: Applying currency formatting to a whole range of cells at once.
- Sorting and Filtering: Organizing a block of data based on a specific column.
The following image shows a practical example of two ranges being used inside a single function.

For a final perspective, let's turn to the "Commerce by Harshita" channel resource you're familiar with. The presenter explains the why behind using ranges—connecting it directly to applying formulas.
Computerized Accounting | SPREADSHEET | Class-12 | ISC | Section C | Accounts | Shubham Jagdish
In this segment, the presenter explains that since spreadsheets are used to process data, you need to define the 'area' or 'range' of data a formula should apply to.
Watch the clip from 16:03 to 18:27. The key takeaway is how a range (e.g., B2:D2) is defined in the formula bar to tell the spreadsheet which cells to include in a calculation.
Conclusion
You've now moved from working with individual cells to commanding entire blocks of data. Understanding and using cell ranges is a non-negotiable skill for using spreadsheets effectively in accounting. It's the bridge between entering data and actually analyzing it.
Key Takeaways:
- A cell range is a selected group of cells.
- It's defined by its top-left and bottom-right cells, separated by a colon (e.g.,
B2:D10). - Ranges can be adjacent (a single block) or non-adjacent (separate blocks selected using the
Ctrlkey). - The primary use of ranges is to serve as efficient inputs for formulas, functions, charts, and formatting, saving time and reducing errors.
In our next lesson, we'll continue to explore ways to organize and present our spreadsheet data. We will learn how to combine multiple cells into one by merging cells, and how to apply professional number formatting (like currency, percentages, and dates) to make our financial data clear and readable.