Hello! Welcome to our new module on Data Analysis and Visualization.
In our previous lessons, we wrapped up Module 4 by focusing on data integrity, culminating in how to set up custom 'Error Alerts' to guide users and prevent incorrect data entry. Now that we have a solid foundation for ensuring our data is clean and accurate, we can move on to the exciting part: turning that raw data into meaningful insights.
This lesson marks the beginning of Module 5 and addresses the learning outcome: Identify and describe key chart elements, including data labels, legends, and data series. Mastering this is fundamental for your CBSE exam, as questions often require you to describe the components of a chart or graph.
1. From Numbers to Pictures: The Anatomy of a Chart
As the saying goes, "A picture is worth a thousand words." In accounting, charts and graphs are those pictures. They transform rows and columns of financial data into visual stories, making it much easier to spot trends, compare performance, and communicate information effectively.
Before we can create our own charts, we first need to learn their language by understanding their basic components.
Take a look at the chart below. It visually represents quarterly sales data. We will use it as our guide to identify the key elements.
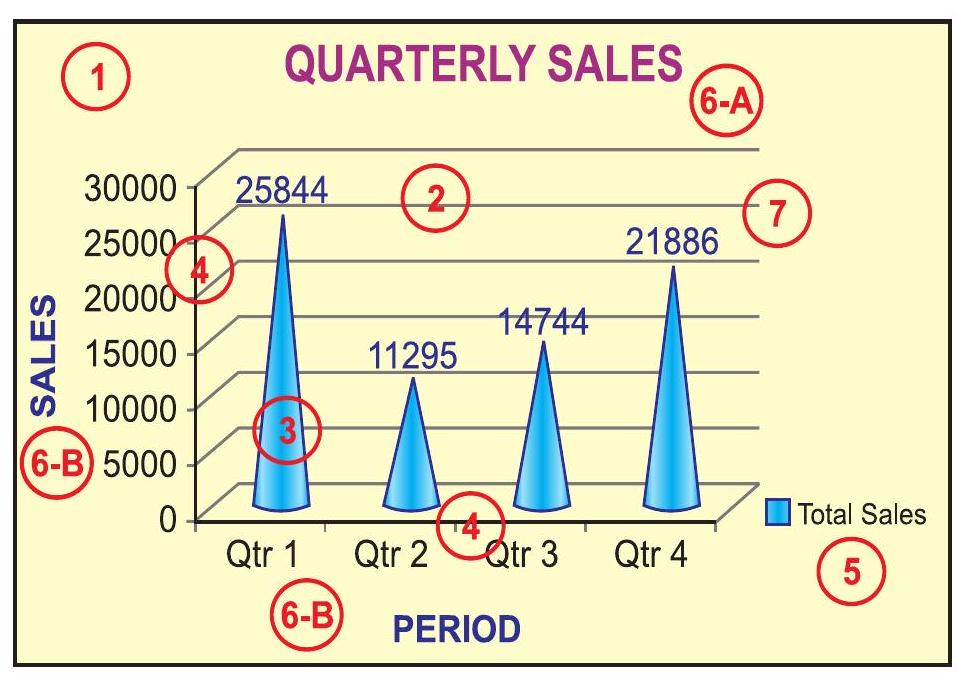
The three most important elements for you to identify and describe for your exam are the data series, the legend, and the data labels. Let's break them down one by one.
2. The Core Elements of a Chart
a) Data Series
A data series is a set of related values that you want to plot. In the chart above, the four blue bars representing the sales for Qtr 1, Qtr 2, Qtr 3, and Qtr 4 together form a single data series called "Total Sales".
- Definition: A data series consists of related data points plotted on a chart. Each series is typically represented by a unique color or pattern.
- Example: In a chart comparing the sales of "Product A" and "Product B" over twelve months, you would have two data series: one for Product A's sales (perhaps represented by blue bars) and another for Product B's sales (e.g., orange bars).
To see this concept in action, let's watch a short video clip. It shows how adding a new column of data to your selection creates a new data series in the chart.
Excel Charts & Graphs: Learn the Basics for a Quick Start
This video from Leila Gharani's 'Excel Charts & Graphs' tutorial demonstrates how to add a new data series to an existing chart. This will help you visualize what a 'data series' actually is.
Watch the clip from 07:54 to 09:00. Notice how the chart initially has one data series ('Actuals') and how a second series ('Budget') is added by expanding the data selection. The video also mentions the 'Select Data' option, which is another way to manage series.
b) Legend
Now that we know a chart can have multiple data series, how do we tell them apart? That's the job of the legend.
- Definition: A legend is a key that identifies what each color, pattern, or symbol used in the chart represents. It links the visual elements (like the blue bars) to the data series name (like "Total Sales").
- Example: In our bar chart image, the legend in the bottom-right corner tells us that the blue bars represent "Total Sales". If we added a second data series for "Budgeted Sales" in orange, the legend would show an orange square next to the words "Budgeted Sales".
A legend is crucial for the readability of any chart with more than one data series. Let's see how you can add and position one.
Excel Charts & Graphs: Learn the Basics for a Quick Start
This next clip from the same video shows how to add and edit a legend. This is a practical skill that helps make your charts clearer.
Watch from 12:47 to 13:21. Pay attention to how the legend is added using the 'plus' sign next to the chart and how its position can be changed (e.g., to the top).
c) Data Labels
Sometimes, looking at the height of a bar or the position of a point on a line gives you a general idea of its value, but you need the exact number. This is where data labels come in.
- Definition: A data label is text that provides specific information about a data point on the chart. Most commonly, it displays the exact value of that point.
- Example: In the "QUARTERLY SALES" chart, the numbers
25844,11295,14744, and21886appearing above each bar are the data labels. They tell us the precise sales figure for each quarter without requiring us to guess based on the vertical axis.
Data labels make your chart much more informative at a glance. You can add them using the same 'Chart Elements' menu as the legend.
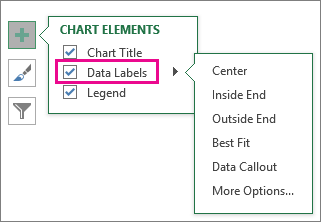
To see how to add and position these labels, let's watch one more quick clip.
Excel Charts & Graphs: Learn the Basics for a Quick Start
This clip demonstrates how to use the 'plus' sign to add data labels and choose where they should appear on the chart.
Watch from 03:55 to 04:30. The video shows how ticking the 'Data Labels' box instantly adds the values to the chart's bars and how you can use the arrow to select different placement options.
3. Reading for Reinforcement
You have now been visually introduced to the key chart elements. To solidify your understanding and ensure you can define these terms accurately for your exam, please read the following section from your digital textbook. It provides formal definitions for these elements and others.
[PDF] ACCOUNTANCY - Knowledge Gallery
This section from your NCERT-based textbook, 'ACCOUNTANCY', formally defines the core elements of a chart. An exercise question at the end of this chapter directly asks you to describe data series, legend, and data labels, so this reading is essential.
Please read section '4.2.1 ELEMENTS OF A CHART/GRAPH'. You can find this on page 108 of the PDF. Focus on the definitions provided for items 3 (data points/data series), 5 (legend), and 7 (data label).
For a quick, alternative summary of these definitions, you can also review the following resource.
Getting to Know the Parts of an Excel 2010 Chart
This article from Dummies.com offers a concise, easy-to-understand list of definitions for all the major parts of an Excel chart.
Read the bulleted list of definitions. Pay special attention to the descriptions for 'Data series', 'Legend', and the related concept of a 'Data marker'.
Conclusion
Great work today! You have successfully learned to identify and describe the fundamental building blocks of a chart. Understanding these components is the first and most critical step toward mastering data visualization for your accounting analysis and your exam.
Key Takeaways:
- Data Series: A group of related data points plotted on a chart, usually shown in a single color or style.
- Legend: The key that explains what the different colors or patterns in a chart represent, identifying each data series.
- Data Labels: Text that provides the exact value or other information for a specific data point, making the chart more precise.
- Other important elements include the Chart Title, Axes (horizontal/category and vertical/value), and the Plot Area.
In our next lesson, we will build on this knowledge. Now that you can identify the parts of a chart, you will learn how to assemble them by following the steps to create a chart from a selected data range.