Hello! Welcome back to our course on Computerized Accounting.
In our last two lessons, we learned what the core elements of a chart are and how to create a basic chart from a set of data. Creating a chart is the first step, but refining it for clarity is just as important. A well-placed legend can be the difference between a confusing graph and a clear, professional one.
This lesson focuses on a simple but crucial customization skill: explaining how to reposition a legend on a chart. This is a practical skill for making your data visualizations more effective and is a common type of question in the CBSE exam.
1. Recap: What is a Legend?
Before we move a legend, let's quickly remember what it is. As we discussed two lessons ago, a legend is an identifier for the data series in your chart. It acts like a key, helping the reader understand what each color, pattern, or symbol represents.
Now, let's learn how to control where this key is placed.
2. Repositioning a Legend: The Primary Method
In modern spreadsheet applications like Microsoft Excel, the quickest way to adjust chart elements is by using the Chart Elements menu, which appears as a plus sign (+) when you select a chart.
Let's walk through the specific steps.
This guide from Microsoft Support provides the most direct instructions for moving a chart legend. We will focus on the main method it describes.
Please read the two steps at the very top of the page. The instructions are clear and concise, showing how to use the 'Chart Elements' button to change the legend's location.
Based on the reading, the steps are:
- Click on the chart to select it. This will make the chart editing tools appear.
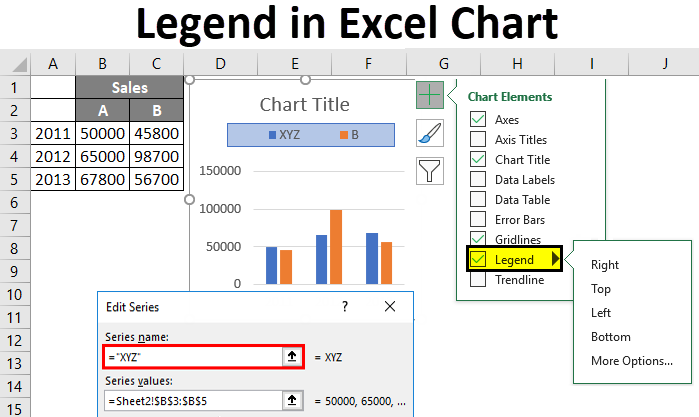
- Click the Chart Elements button (the + icon) on the top-right side of the chart.
- In the menu that appears, hover your mouse over Legend. An arrow will appear to the right.
- Click the arrow to see a list of position options: Right, Top, Left, Bottom.
- Select the position you want, and the legend will move instantly.
The image below shows this process in action.
3. An Alternative Method: The 'Chart Design' Tab
It's also useful to know another way to achieve the same result using the main ribbon menu. This can be helpful if you're using a different version of the software or just prefer using the top menu.
The same Microsoft resource also outlines this alternative method using the 'Chart Design' tab. It's good practice to be aware of multiple ways to perform a task.
Scroll down to the section for Mac users (the steps are nearly identical for Windows). Read the instructions under the 'Add Chart Element > Legend' heading. This shows the path through the main application menu.
To summarize this second method:
- Click on the chart to select it.
- The Chart Design tab will appear in the top ribbon. Click on it.
- On the far left, click the Add Chart Element button.
- Hover over Legend in the dropdown menu.
- Select your desired position from the side menu that appears.
4. Exam Relevance: Why This Matters
This might seem like a small detail, but it's a tested concept. Your NCERT textbook includes questions that directly relate to this skill, confirming its importance for the board exam.
Let's look at the textbook's context.
[PDF] ACCOUNTANCY - Knowledge Gallery
Your NCERT textbook discusses the general process of formatting chart elements. This provides the foundation for specific actions like moving a legend.
Please find and read section 4.2.2, titled 'FORMATTING OF CHART'. Focus on how it describes the general method for changing chart elements using the 'Design' and 'Format' tabs.
More importantly, the exercise section of this chapter includes a multiple-choice question that directly tests your knowledge of this topic:
10. Legend can be repositioned on the chart:
a. anywhere.
b. on right side only.
c. on the bottom of X-axis.
d. on the corner only.
Knowing the options we've just learned (Top, Bottom, Left, Right, and even more advanced options) allows you to confidently answer such a question. The most accurate choice here would be (a) anywhere, because the "More Options..." choice gives you fine-tuned control over placement.
Conclusion
Great job! You can now confidently explain how to reposition a chart legend using two different methods. This simple skill is key to creating clean and easy-to-read charts for your accounting reports and analyses.
Key Takeaways:
- A legend identifies the data series in a chart and is crucial for readability.
- The primary method to move a legend is: Click Chart -> 'Chart Elements' (+) button -> Legend -> Choose Position.
- An alternative method is: Click Chart -> 'Chart Design' tab -> 'Add Chart Element' -> Legend -> Choose Position.
- This skill is directly relevant to the CBSE syllabus, as shown by questions in the NCERT textbook.
In our previous lessons, we learned to create and customize charts for visualizing data. In our next lesson, we will explore one of the most powerful tools in spreadsheets for data analysis: the Pivot Table. You will learn what a Pivot Table is and why it is so valuable for summarizing and analyzing large datasets quickly.