Hello and welcome back to our course on Computerized Accounting.
In our recent lessons, we explored how to create and customize charts to visually represent data. While charts are excellent for visualization, accounting often requires us to summarize, group, and analyze large volumes of transactions. For this, we need a more powerful tool.
This lesson introduces you to one of the most essential features in any spreadsheet application for data analysis: the Pivot Table. Our goal is to define a Pivot Table and explain its advantages for data summarization and analysis. This is a frequent topic in the CBSE exam, so mastering this concept is crucial for your preparation.
1. What is a Pivot Table?
Imagine you have a long list of sales data with hundreds or thousands of rows. Each row details a single transaction: date, product, region, salesperson, and sales amount. Now, what if you need to quickly find the total sales for each region? Or the total sales per salesperson? Doing this with formulas would be time-consuming. This is where a Pivot Table comes in.
In simple terms, a Pivot Table is an interactive report that lets you summarize and rearrange large amounts of data without writing a single formula.
To get a quick overview, please watch the first part of the following video.
Pivot Tables Explained in 3 Minutes
This video from Excel Campus - Jon provides a concise and clear introduction to what Pivot Tables are and why they are so useful.
Please watch from the beginning until 01:46. Focus on how the video defines a Pivot Table as a 'summary report' and highlights its flexibility.
As the video explains, a Pivot Table takes your detailed raw data and transforms it into a summarized table. You can "pivot" or reorganize this table by simply dragging and dropping fields to see the data from different perspectives.
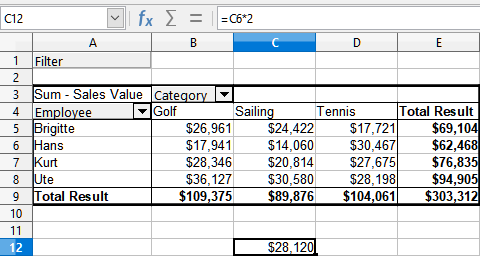
Here is an example of what a simple Pivot Table looks like. It takes raw sales data and summarizes the total sales value for each employee by product category.
2. The Core Idea: Interactive Summarization
The real power of a Pivot Table lies in its interactivity. You are not locked into one view. You can dynamically change the layout to answer different questions.
For example, you can:
- Start by viewing sales by region.
- Then, add a salesperson field to see which salesperson performed best in each region.
- Instantly "pivot" the table to show sales by product category instead of by region.
Watch this short clip to see this flexibility in action.
MS Excel - Pivot Table Example 1 Video Tutorials
This video from TutorialsPoint demonstrates how you can drag and drop fields to change the structure of a Pivot Table instantly.
Watch from 01:45 to 03:41. Pay close attention to how the instructor drags the 'Region' and 'Name' fields between the 'Rows' and 'Columns' areas and how the table layout changes immediately.
This ability to rearrange data on the fly is what makes Pivot Tables an indispensable tool for analysis.
3. Key Advantages of Pivot Tables (Exam Focus)
Your board exam directly asks about the advantages of Pivot Tables. In the 2025 sample paper (resource_id=[LINK](https://collegedunia.com/news/e-704-cbse-class-12-accountancy-question-paper-2025-set-2-67-2-2)), Question 32 is "State the advantages of 'Pivot Table' report."
The best source for answering this question is your NCERT textbook, as it aligns with the official curriculum. Please read the section on advantages from the textbook.
[PDF] ACCOUNTANCY - Knowledge Gallery
This section from your NCERT textbook lists the key advantages of using a Pivot Table report. You should aim to be able to recall and explain these points for your exam.
Please find the subsection titled 'Advantages of Pivot Table (Report)' and read through the bulleted list. The section starts right after a series of figures labeled 2.58(c) to (f).
Let's break down these advantages with some practical context:
-
Querying large amounts of data: You can get answers from thousands of rows of data in seconds, a task that would be very difficult with manual methods.
-
Subtotaling and aggregating data: Pivot Tables automatically calculate sums, counts, averages, maximums, and minimums for your data. You can group data by categories (like city or vegetable type in the textbook example) and get subtotals for each.
-
Expanding and collapsing data (Drill-down): You can view a high-level summary (e.g., total sales per region) and then "drill down" to see the detailed transactions that make up that total. This is a fantastic feature for auditing or verifying figures.
To see how this works, watch this brief clip.
MS Excel - Pivot Table Example 1 Video Tutorials
This clip from the TutorialsPoint video demonstrates the 'drill-down' feature, one of the most powerful advantages of a Pivot Table.
Watch from 03:41 to 04:38. Notice how double-clicking a single summarized number instantly creates a new sheet showing all the individual records that contribute to that number.
- Pivoting (moving rows to columns): As we saw earlier, you can change the entire perspective of your report by moving fields between row and column areas, allowing you to explore different relationships in your data.
- Filtering, sorting, and grouping: You can focus on just the information you need by filtering out irrelevant data (e.g., show sales for only one region) or sorting results (e.g., from highest to lowest sales).
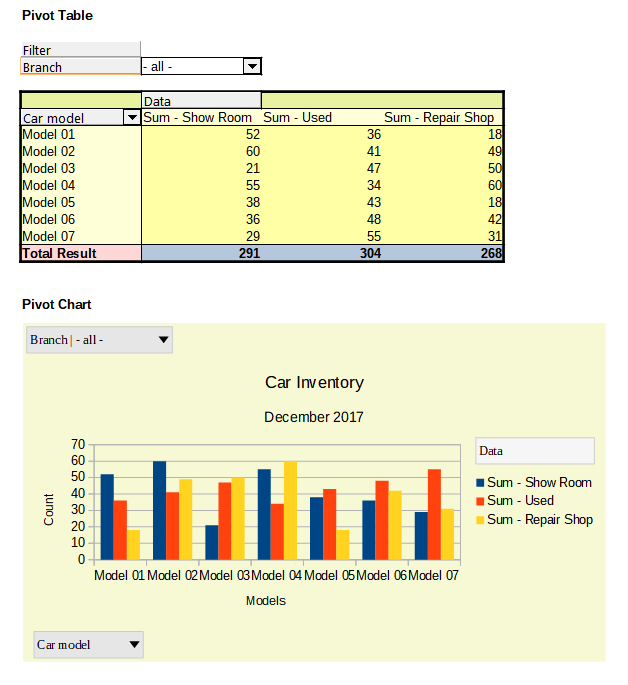
- Presenting concise and attractive reports: Pivot Tables can be formatted to create professional-looking reports that are easy to read and understand. They can also be connected to Pivot Charts, which are charts that update automatically when the Pivot Table changes.
Conclusion
In this lesson, we have defined what a Pivot Table is and explored its significant advantages for summarizing and analyzing data. This is a fundamental skill in computerized accounting and a high-value topic for your exam.
Key Takeaways:
- A Pivot Table is an interactive tool for quickly summarizing large datasets without needing to write complex formulas.
- Its main function is to aggregate data (sum, count, average) and allow you to "pivot" the data by moving rows and columns to gain different insights.
- The key advantages are its ability to query large datasets, create dynamic summaries, drill down into details, filter and sort data, and generate professional reports and charts.
Now that you understand what a Pivot Table is and why it is so powerful, our next lesson will focus on the practical steps. We will learn how to outline the steps to create a Pivot Table from a given dataset.