Hello! Welcome back to our course on starting your crypto journey with Binance.
In our last lesson, you learned the language of the market by reading individual candlesticks. You can now look at any candle and understand the story of its open, high,low, and close prices. That's the first essential step in chart analysis.
Today, we're going to zoom out. Instead of looking at single candles, we'll learn how to identify basic support and resistance levels on a price chart. These levels are like a roadmap for the price, showing us key areas where the market has historically made a decision to either reverse or break through. Mastering this will give you a fundamental framework for deciding where you might want to buy or sell.
What are Support and Resistance?
At its core, the concept is simple. Think of the price moving between a floor and a ceiling.
- Support is the "floor." It's a price level where buying pressure is strong enough to overcome selling pressure, causing the price to stop falling and "bounce" back up.
- Resistance is the "ceiling." It's a price level where selling pressure overcomes buying pressure, causing the price to stop rising and turn back down.
To get a clear definition and see how these levels look on a chart, let's start with a short reading from the Binance blog.
Basic Concepts of Support and Resistance - Binance
This article, 'Basic Concepts of Support and Resistance' from Binance, clearly defines these concepts using the floor and ceiling analogy. It also importantly points out that these are best thought of as zones, not exact lines.
Please read the sections 'Introduction' and 'What is support and resistance?'. Focus on the definition of each term and the idea of them being 'areas' or 'zones'.
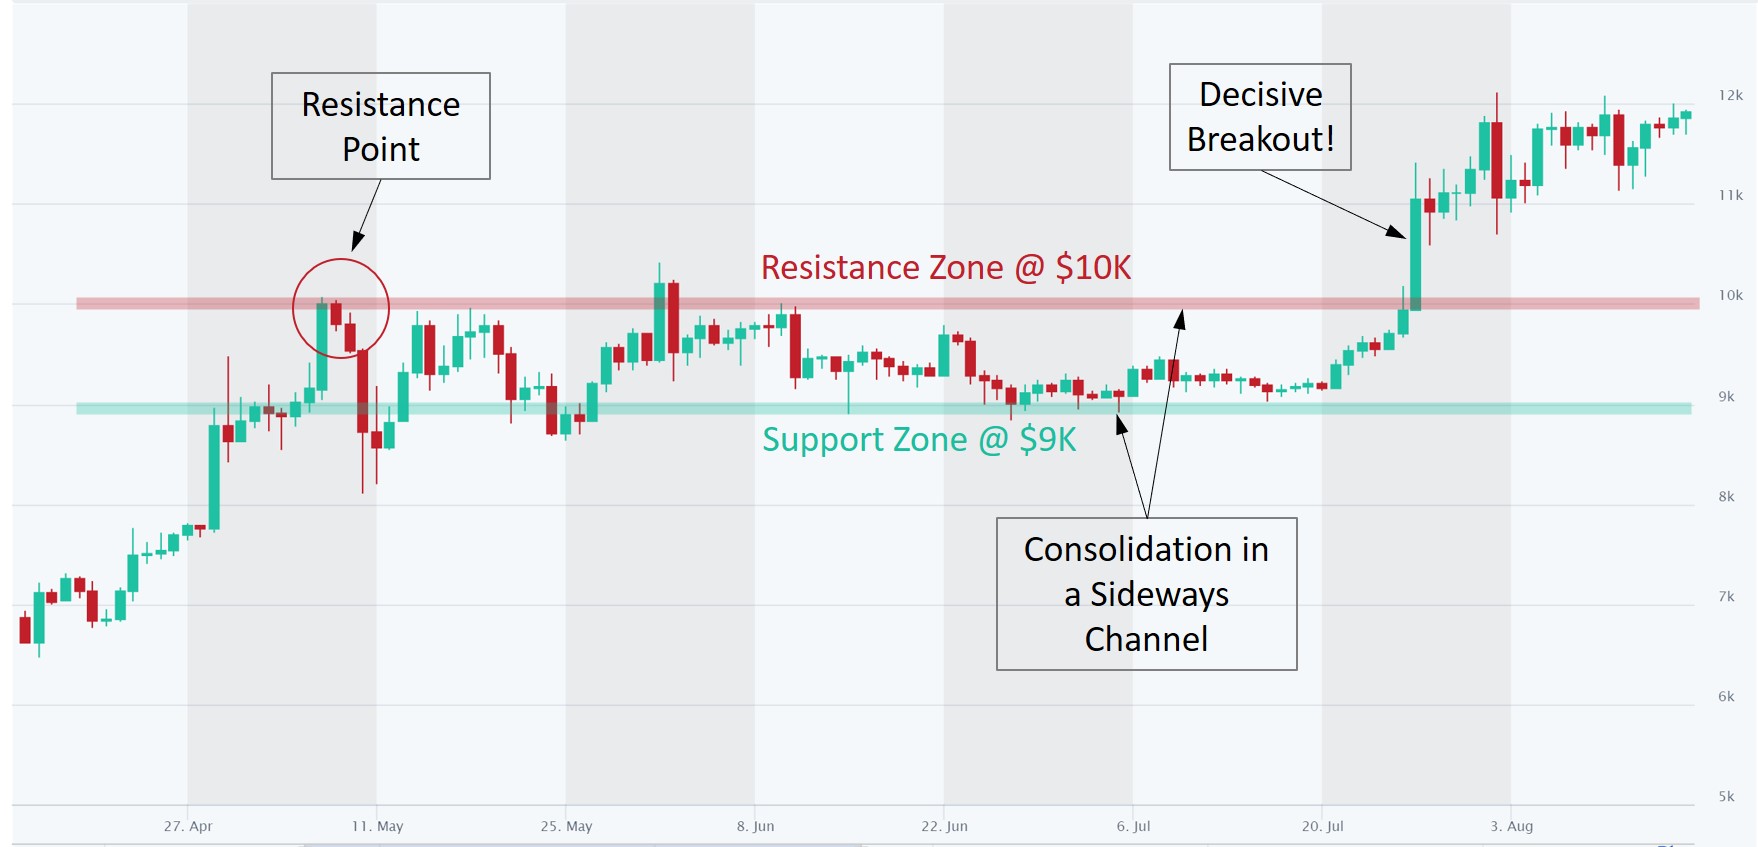
As the article explained, these levels are formed by market psychology. Traders remember where the price reversed before and tend to place orders around those same levels again, which reinforces them.
Here is a visual representation:
Why Are These Levels Important for Trading?
Identifying support and resistance gives your trading a structure. Instead of buying or selling randomly, you can plan your trades around these key areas. The following video explains this idea well.
Crypto Trading Masterclass 07 - How To Find Support And Resistance Levels
In this clip from 'Crypto Trading Masterclass 07', the presenter explains the practical value of using support and resistance to avoid emotional trading and create a structured plan.
Watch the segment from 01:54 to 02:43. Pay attention to how the speaker describes using these levels to know where to buy (on support) and where to sell (at resistance).
How to Identify Support and Resistance Levels
The key to finding these levels is to look at historical price data. You are looking for areas on the chart where the price has "tapped" or reversed multiple times.
A good rule of thumb is to look for at least two to three clear touches to validate a level. The more times a level has been tested and held, the stronger it is considered.
This next video gives a very clear, practical method for identifying valid levels.
Support & Resistance Trading Strategy Was Hard, Until I Understood This
This video, 'Support & Resistance Trading Strategy Was Hard, Until I Understood This', provides a great rule of thumb for finding valid levels.
Watch from 06:29 to 08:12. The presenter explains what constitutes a valid support or resistance level (more than three 'taps') and why levels on higher timeframes (like the daily chart) are more significant.
When the Floor Becomes the Ceiling: The Support-Resistance Flip
One of the most powerful concepts in technical analysis is what happens when one of these levels breaks.
- When a resistance level is broken, it often becomes the new support level.
- When a support level is broken, it often becomes the new resistance level.
This is sometimes called a "support-resistance flip" or a "break and retest."
Crypto Trading Masterclass 07 - How To Find Support And Resistance Levels
Let's return to the 'Crypto Trading Masterclass 07' video. The presenter uses a fantastic analogy of breaking through a rooftop and turning it into your new floor to explain this concept.
Watch from 02:43 to 05:30. Focus on the 'rooftop and floor' analogy and the explanation of turning resistance into support (and vice-versa).
Here's an image that shows this exact phenomenon on a real Binance chart.

Practical Exercise: Finding Levels on Binance
Now it's time to put this into practice, which is the best way to learn.
- Open your Binance account and navigate to the Spot Trading interface for a major pair like BTC/USDT.
- Set the chart timeframe to '1D' (1 Day). This gives you a broader view of significant price history.
- Look for the drawing tools on the left side of the chart. Select the Horizontal Line tool.
- Identify Resistance: Zoom out and look for clear peaks where the price turned down. If you see two or more peaks at roughly the same price level, draw a horizontal line there. You've just marked a resistance level.
- Identify Support: Now, look for clear valleys where the price bounced up. If you see two or more bounces from the same price area, draw a horizontal line. You've marked a support level.
- Find a Flip: Scan your chart. Can you find an area where a resistance line you drew was broken, and then later the price came back down to "test" that same line as new support?
Spend about 15-20 minutes doing this. Try it on a few different timeframes like the '4h' (4-hour) as well. The goal is not to be perfect, but to train your eyes to see these important zones.
A Few Final Tips
- Zones, Not Lines: As you probably noticed, the price rarely reverses at the exact same price. It's better to think of support and resistance as zones or areas, not as razor-thin lines.
- Psychological Levels: Keep an eye out for big, round numbers (e.g., $50,000 or $60,000 for Bitcoin). These often act as "psychological" support or resistance simply because many people are watching them.
- Confirmation is Key: A level becomes stronger with each test. A breakout above resistance is more convincing if it happens with a long, green candle.
Conclusion
Excellent work today! You've moved beyond single candlesticks and are now learning to read the structure of the market itself. This is a huge leap forward in your ability to analyze charts and make more informed trading decisions.
Key Takeaways:
- Support is a price "floor" where buying pressure tends to stop a downtrend.
- Resistance is a price "ceiling" where selling pressure tends to stop an uptrend.
- These levels are identified by finding historical areas where the price has reversed multiple times.
- When a support level breaks, it can become new resistance. When a resistance level breaks, it can become new support. This is a support-resistance flip.
- It's best to think of these as zones, not exact lines.
What's Next?
Support and resistance levels tell you where the price might turn. In our next lesson, we will introduce a new tool to help you understand which way the price is generally heading. We will learn how to apply a moving average indicator to identify price trends. This will add another powerful layer to your analysis toolkit.