Hello! Welcome back to our course.
In our last lesson, we focused on identifying support and resistance levels—the "floors" and "ceilings" on a price chart. This gave you a crucial framework for seeing where the price might stop or reverse.
Today, we're adding another essential tool to your analysis toolkit. We'll explore how to apply a moving average indicator to identify price trends. While support and resistance tell you about potential price levels, moving averages help you understand the overall direction of the market—is it generally heading up, down, or sideways? This will help you decide whether you should be looking for buying or selling opportunities.
What is a Moving Average?
Imagine you run an online business and your daily sales fluctuate a lot. To see the real growth trend, you might calculate the average sales over the last 30 days. A moving average (MA) does the exact same thing for a crypto asset's price. It smooths out the day-to-day "noise" of price fluctuations to reveal the underlying trend more clearly.
Let's watch a short video that defines this concept and explains its primary purpose.
The ONLY Moving Average Trading Guide You'll EVER Need!
This clip from 'The ONLY Moving Average Trading Guide You'll EVER Need!' by Tom Crown gives a great overview of what a moving average is and why it's so useful for traders.
Watch from the beginning until 01:30. Focus on how the speaker describes MAs as a tool to 'filter out the noise' and 'highlight the underlying trend'.
How to Read a Moving Average to Identify Trends
The video you just watched introduced the fundamental rule for using an MA to identify a trend. It's quite straightforward:
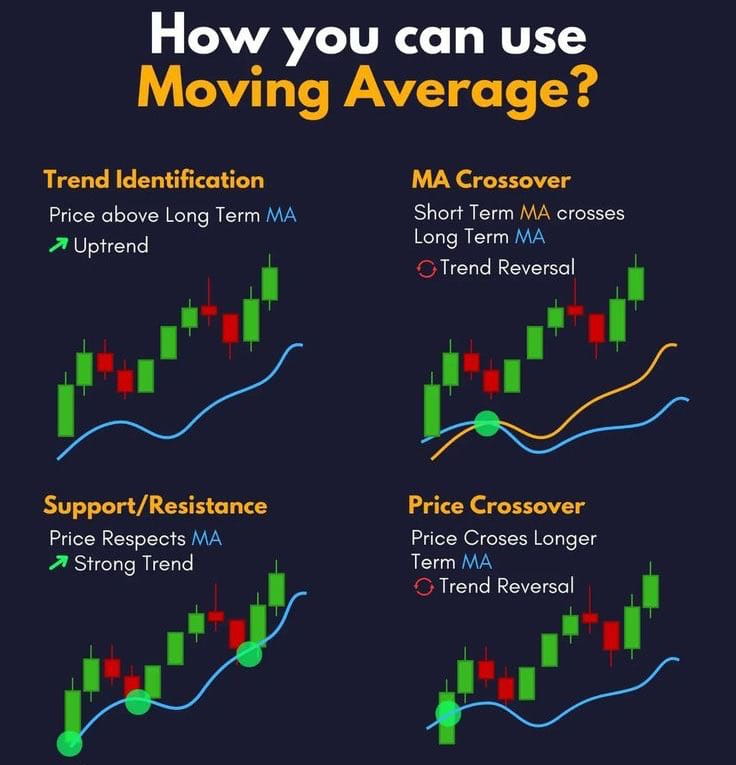
- Uptrend: When the price is consistently trading above the moving average line, it signals a potential uptrend.
- Downtrend: When the price is consistently trading below the moving average line, it signals a potential downtrend.
The MA line itself can also act as a dynamic level of support or resistance, a concept we'll touch on later.
Types of Moving Averages: SMA vs. EMA
You'll encounter two main types of moving averages on Binance and other trading platforms:
- Simple Moving Average (SMA): This is the most basic type. It calculates the average price over a set period, giving equal weight to all prices in that period. It's smoother and slower to react to recent price changes.
- Exponential Moving Average (EMA): This type gives more weight to the most recent prices. This makes it more responsive to new information and quicker to react to price changes.
For a beginner, and for most crypto trading, the EMA is often preferred because of its responsiveness.
To solidify your understanding of the differences, let's turn to a short reading from the Binance Blog.
How to Use Trading Indicators Effectively? | Binance Blog
The article 'How to Use Trading Indicators Effectively?' provides a clear, concise written explanation of moving averages, including the distinction between SMAs and EMAs.
Read the section titled 'Moving Averages'. Pay close attention to the paragraphs that define Simple Moving Averages (SMAs) and Exponential Moving Averages (EMAs) and the key difference between them.
Choosing the Right "Length" or Period
Every MA needs a time period, or "length." This tells the indicator how many past candles to include in its calculation (e.g., a 20-period MA on a daily chart averages the last 20 days). There's no single "best" period, but there are common conventions:
- Short-term trends: 10, 20, or 21-period MAs.
- Mid-term trends: 50-period MA. This is a very popular choice.
- Long-term trends: 100 or 200-period MAs. These are watched by many traders to gauge the overall health of the market.
For now, we'll focus on using a mid-term MA like the 50-period EMA.
Practical Exercise: Adding a Moving Average on Binance
It's time for some hands-on practice. Let's add a moving average to your Binance chart.
The ULTIMATE Binance Tutorial (2026) | How to use Binance for Beginners | Crypto Trading on Binance
The following clip from 'The ULTIMATE Binance Tutorial' provides a step-by-step walkthrough of how to find, add, and customize indicators like moving averages directly on the Binance trading interface.
Watch from 00:31:46 to 00:33:31. Follow along on your own Binance account to add a 50-period moving average (MA or EMA) to the BTC/USDT chart. You can also change the color and thickness to make it stand out.
Your task:
- Go to the BTC/USDT Spot trading page on Binance.
- Set the chart timeframe to 1D (1 Day).
- Follow the video's instructions to add a 50-period EMA (Exponential Moving Average). If you only see "MA", that's fine too for this exercise.
- Look at the chart. Can you spot the long periods where the price was above your 50-period MA? That was the uptrend. Now find the periods where it was below. That was the downtrend.
An Advanced Technique: The Moving Average Crossover
A single moving average is great for identifying the current trend. A more advanced technique, which can help you spot when a trend might be changing, is to use two MAs at once: one short-term (e.g., 20 EMA) and one long-term (e.g., 50 EMA).
You then watch for when they cross over each other.
- Golden Cross (Bullish): When the shorter-term MA crosses above the longer-term MA. This can signal the beginning of a new uptrend.
- Death Cross (Bearish): When the shorter-term MA crosses below the longer-term MA. This can signal the beginning of a new downtrend.
The article below explains this popular strategy.
4 Trading Strategies With Moving Averages
This Binance Academy article, '4 Trading Strategies With Moving Averages', details the popular crossover strategy.
Please read section '1. Double Moving Average Crossover'. Focus on the definitions of the Golden Cross and the Death Cross.
Here is what these crossovers look like on a real chart:

Conclusion: Putting It All Together
Today you've learned a powerful technique to add context to your chart analysis. You're no longer just looking at individual candles or static lines; you're now able to identify the market's dynamic direction.
One crucial thing to remember is that moving averages are lagging indicators. They are based on past prices, so they confirm a trend rather than predict it. This is why they are best used in combination with other tools, like the support and resistance levels you learned about in the last lesson. For example, a bounce off a support level is a much stronger signal if the price is also above a key moving average.
Key Takeaways:
- A Moving Average (MA) smooths price data to make the underlying trend easier to see.
- When the price is above the MA, it suggests an uptrend. When it's below, it suggests a downtrend.
- EMAs react faster to price changes than SMAs.
- A Golden Cross (short-term MA crosses above long-term MA) is a bullish signal.
- A Death Cross (short-term MA crosses below long-term MA) is a bearish signal.
What's Next?
You now know how to identify key levels (support/resistance) and the market's direction (moving averages). But how can you gauge the strength or conviction behind a price move? In our next lesson, we will explore this by learning how to interpret trading volume as a confirmation of price action. This will add another critical dimension to your chart reading skills.