Hello! Welcome to the final lesson in our module on chart analysis.
In our previous lessons, you've learned to read candlestick charts, identify key support and resistance levels, and use moving averages to determine the market's trend. You know what the price is doing and in which direction it's generally heading.
Today, we'll answer a different question: "How strong is this price move?" We'll do this by learning to interpret trading volume as a confirmation of price action. Volume tells you about the level of participation and conviction behind a price movement. Think of it like this: if you launch a new product, a price increase is good, but a price increase driven by thousands of customers (high volume) is far more meaningful than one driven by just a few (low volume). In trading, volume provides this same crucial context.
By the end of this lesson, you'll be able to look at the volume bars on a chart and use them to judge the strength of a trend or the validity of a breakout.
What is Trading Volume?
First, let's establish a clear definition of what "volume" means in trading. It's simply the total amount of an asset—like Bitcoin—that has been traded during a specific period (e.g., in the last hour, day, or week). It represents the total activity of buyers and sellers.
The following video provides an excellent and straightforward explanation.
🛑 STOP Trading Until You Learn VOLUME ANALYSIS...
The video '🛑 STOP Trading Until You Learn VOLUME ANALYSIS...' from Mind Math Money clearly defines volume and shows how it's represented on a chart. This will be our foundation for the lesson.
Watch from 00:37 to 03:17. Pay attention to: The simple definition of volume. How volume is represented by vertical bars at the bottom of the chart. The meaning of the bar's height (amount of volume) and color (tied to the price candle).
As the video explained, you'll see volume as a series of bars at the bottom of your Binance chart. A tall bar means high trading activity for that period, and a short bar means low activity.
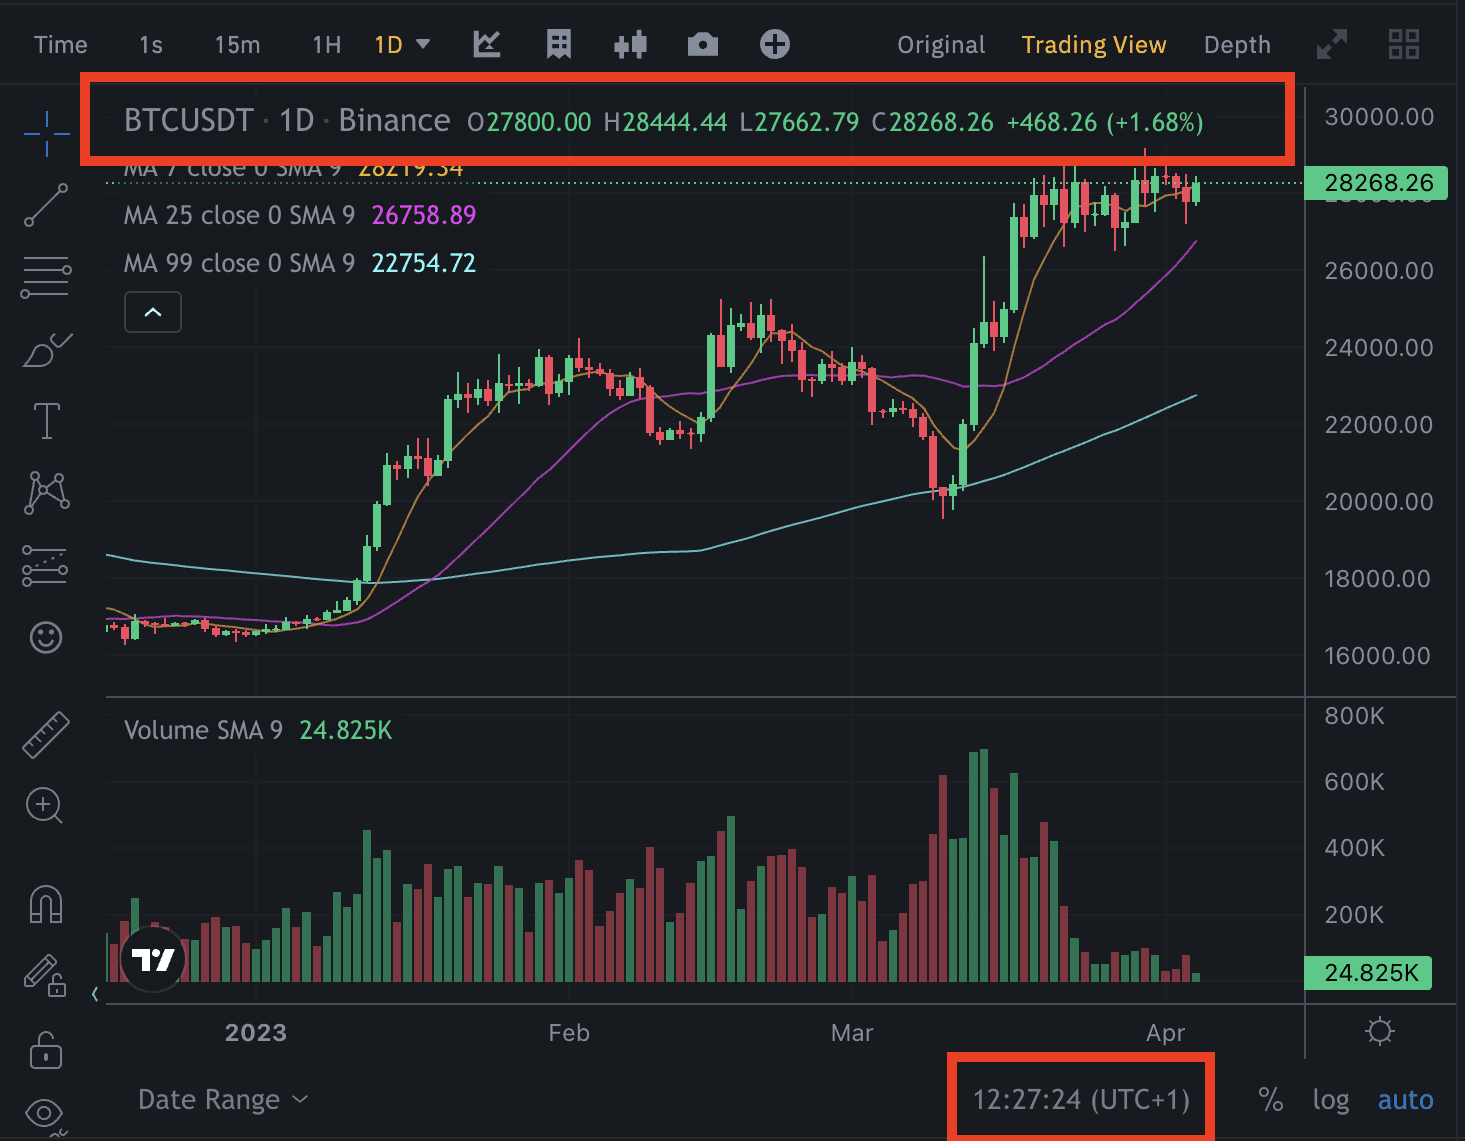
Why Volume is a Powerful Confirmation Tool
A price move on its own doesn't tell the whole story. The volume behind that move reveals the market's conviction. A small price change can be caused by a few small trades, but a significant price move requires a large number of participants.
Let's watch another clip from the same video that perfectly illustrates why this distinction is so important.
🛑 STOP Trading Until You Learn VOLUME ANALYSIS...
This short segment uses a simple but powerful example to show why a price move with high volume is much more significant than the same price move with low volume.
Watch from 03:17 to 04:26. Focus on the core idea: which of the two price moves is more 'bullish' and why.
This concept is the heart of volume analysis. High volume validates price action; low volume questions it.
The Four Key Scenarios of Price and Volume
We can break down the relationship between price and volume into four basic scenarios. Understanding these will dramatically improve your ability to read a chart.
-
Price Increases on High Volume (Bullish Confirmation): This is a strong, healthy sign for an uptrend. It shows that many buyers are enthusiastically pushing the price higher. A trend backed by rising volume is more likely to continue.
-
Price Decreases on High Volume (Bearish Confirmation): This is a strong sign of selling pressure. It shows that many market participants are selling, confirming the downtrend's strength. A trend with high volume on its red candles is likely to continue downward.
-
Price Increases on Low Volume (Bullish Weakness/Warning): This is a warning sign. The price is rising, but there isn't much participation. It suggests a lack of conviction from buyers, and the uptrend may be losing steam and could reverse soon.
-
Price Decreases on Low Volume (Bearish Weakness/Warning): This suggests that the sellers are running out of steam. While the price is falling, fewer people are willing to sell at these lower prices. This can sometimes signal that a downtrend is nearing its end.
The following article provides a concise summary of these rules and gives real-world examples.
Introduction to Crypto Trading Volume and How to Interpret It - Altrady
This article, 'Introduction to Crypto Trading Volume and How to Interpret It' from Altrady, clearly lays out the relationship between price and volume and provides historical market examples.
First, read the section 'Interpreting Cryptocurrencies Volume Trends' to solidify the four scenarios we just discussed. Then, read the 'Real-World Examples' section to see how these concepts played out during major market events like the 2021 Bitcoin bull run and crash.

Using Volume to Confirm Breakouts
One of the most practical uses for volume analysis is confirming breakouts. In a previous lesson, you learned to identify support and resistance levels. When the price breaks through one of these levels, volume tells you if the breakout is "real" or a "fakeout."
- A real breakout above resistance should be accompanied by a spike in volume. This shows strong buyer commitment to push the price into a new, higher range.
- A fakeout often occurs on low volume. The price may poke above resistance, but the lack of participation means there isn't enough buying power to sustain the move, and the price often falls back below the resistance level.
Let's see this in action.
🛑 STOP Trading Until You Learn VOLUME ANALYSIS...
We'll return to the Mind Math Money video to see a clear example of how to use volume to distinguish between a real, high-conviction breakout and a weak, low-volume fakeout.
Watch from 08:28 to 10:16. Notice the difference in the volume bars during the two breakout examples shown.
Practical Step: Finding Volume on Binance
The volume indicator is enabled by default on the Binance trading chart, but it's good to know where it is and how it's labeled.
The ULTIMATE Binance Tutorial (2026) | How to use Binance for Beginners | Crypto Trading on Binance
In this final video, we'll quickly see where the volume indicator is located on the Binance interface. You've already seen it in action, but this clip from 'The ULTIMATE Binance Tutorial' will confirm its location for you.
Watch from 00:33:31 to 00:34:30. The presenter introduces the volume indicator and briefly explains what it shows. As a practical exercise, open the BTC/USDT chart on your own Binance account and confirm you can see the volume bars at the bottom.
Conclusion
Congratulations on completing the Chart Analysis module! You now have a solid foundation for interpreting price action. You can identify key levels, gauge the trend's direction, and now, assess the conviction behind price movements using volume. Remember that these tools work best when used together. A price bounce from a support level is a good signal. A bounce from support that is also above the 50-day moving average is even better. But a bounce from support, above the MA, and on high volume—that is a high-quality signal that commands a trader's attention.
Key Takeaways:
- Trading volume measures the total amount of an asset traded in a given period, reflecting market participation.
- High volume acts as confirmation, validating the strength of a price move (both up and down).
- Low volume during a price move is a warning sign, suggesting a lack of conviction and a potential reversal.
- A breakout through support or resistance is much more reliable if it occurs on high volume.
- Volume is not a standalone indicator; it is most powerful when combined with price action, support/resistance, and trend indicators like moving averages.
What's Next?
You have learned the fundamentals of reading charts. Now it's time to transition from analysis to action. In our next module, Active Trade and Risk Management, we will begin to explore how to apply this knowledge to actual trading. The very first and most important lesson will focus on a topic that is critical to long-term success: the importance of risk management in preserving your capital.