Welcome back. In our previous lesson, we established a bird's-eye view of the financial markets, understanding their economic purpose and identifying the key players. We concluded by highlighting one of the market's most critical functions: Price Discovery. This lesson will zoom in on that exact function.
Today, we will dissect the core engine that drives all price movement: the dynamic interplay of supply and demand. By the end of this lesson, you will be able to describe how these fundamental economic forces interact to determine the price of any tradable asset. Mastering this concept is non-negotiable for a trader, as every chart, pattern, and indicator you will ever use is ultimately a reflection of this underlying battle between buyers and sellers.
The Foundational Laws of Price
At the heart of any market, from a local farmer's market to the global forex market, are two fundamental laws: the Law of Demand and the Law of Supply. Your physics background gives you a deep appreciation for universal laws that govern systems, and in economics, these are just as foundational.
Let's begin by reading a concise explanation of these two laws.
Supply and Demand Zone: Meaning, Rules, Types & How to Use
This article from 5paisa clearly defines the two core principles governing market prices.
Please read the section titled Laws of Supply and Demand Trading. Focus on understanding the inverse relationship for demand and the direct relationship for supply.
To summarize:
- The Law of Demand: All else being equal, as the price of an asset falls, the quantity demanded by buyers increases.
- The Law of Supply: All else being equal, as the price of an asset rises, the quantity supplied by sellers increases.
When we plot these two laws on a graph, with price on the vertical axis and quantity on the horizontal axis, we get the classic supply and demand curves. The point where they intersect is called equilibrium.
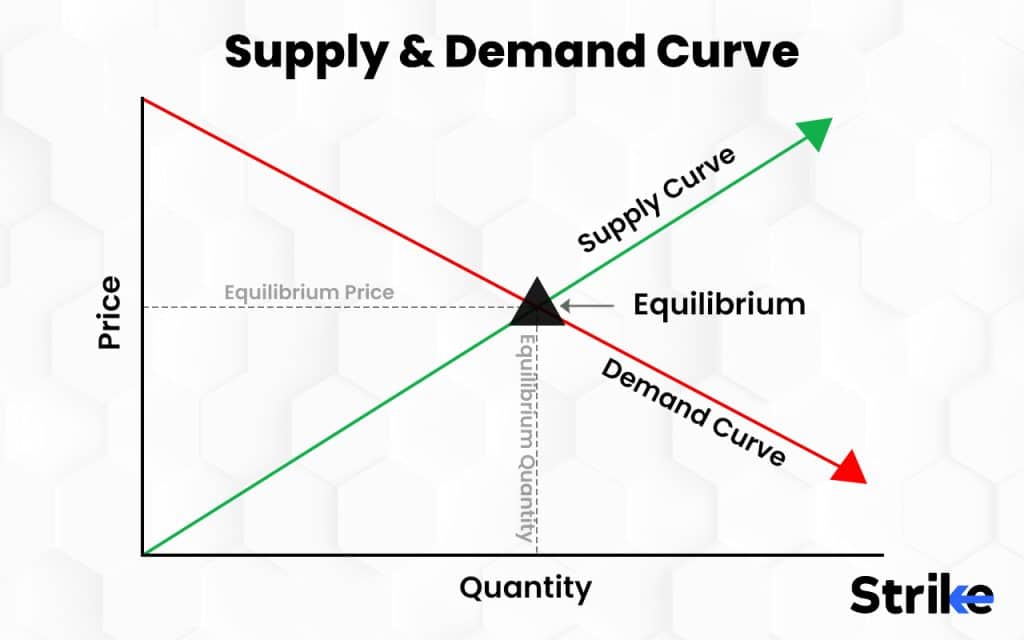
This equilibrium price is the "fair value" that the market has settled on at a specific moment in time.
From Static Equilibrium to Dynamic Markets
The classic graph is a static snapshot. In reality, markets are anything but static. The curves are constantly shifting in response to new information, events, and changes in sentiment. This is the process of price discovery in action.
To get a more dynamic understanding, let's watch a short, animated explanation.
Supply and demand in 8 minutes
This video by economics teacher Jacob Clifford is a masterclass in breaking down supply and demand dynamics quickly and clearly.
Watch the entire video. Pay special attention to two key areas: The "five shifters" for both demand and supply. These are the catalysts that cause prices to change. The concepts of shortage and surplus, which are states of disequilibrium that push the price back toward a new equilibrium.
As the video explained, when demand is greater than supply, a shortage occurs, and buyers must bid prices higher to acquire the asset. Conversely, when supply is greater than demand, a surplus occurs, and sellers must lower their prices to find buyers. The market is in a perpetual state of flux, always moving from one equilibrium point to the next as these forces shift.
This dynamic applies to all the markets you're interested in, including cryptocurrency.

The Real-World Mechanism: The Order Book
So, how does this theoretical dance of supply and demand actually play out on a trading screen? The abstract concepts of "buyers" and "sellers" are made concrete through orders. The process of price discovery happens within the market's order book.
To understand this, we need to read a brief article that frames price discovery as a real-time process.
Understanding Price Discovery in Stock Market: Meaning & How To Determine
This article from Gotrade explains how the abstract idea of supply and demand translates into the real-world process of price discovery.
Read from the beginning down to the end of the section on supply and demand. Focus on these parts: The initial definition of price discovery. The explanation of how the interaction works, introducing the idea of order books with bid and ask prices. The summary of the role of supply and demand as the primary forces.
The article introduces a crucial point: price discovery happens through the interaction of bids (from buyers) and asks (from sellers) in an order book.
Now, let's look under the hood at the engine that drives price. The following video provides a brilliant, step-by-step mechanical explanation of how an order book works. Given your background, you will likely appreciate this shift from abstract forces to a concrete, causal mechanism.
How Markets REALLY Work - Depth of Market (DOM)
This video from Critical Trading demystifies how prices actually move by simulating the interactions within a Depth of Market (DOM) or order book.
This is a critical video. Please watch it carefully from the beginning to the end. Focus on the distinction between: Passive orders (limit orders): These build the supply and demand levels in the order book. They represent potential buyers and sellers waiting at specific prices. Active orders (market orders): These are the "aggressors." They consume the passive orders and are what actually cause the price to move. Pay close attention to the explanation starting around this timestamp, where the narrator makes a key point: "The price didn't move down because there were more sellers than buyers, but because sellers were more aggressive than buyers."
This is perhaps the most important takeaway for a new trader. Price doesn't move simply because there are "more buyers than sellers." For every buyer there must be a seller for a transaction to occur. Price moves when one side becomes more aggressive than the other and is willing to cross the spread to execute a trade at the current market price, consuming the available liquidity at that level and forcing the price to the next level to find more orders.
Conclusion
In this lesson, we moved from the textbook theory of supply and demand to the real-world mechanics of price movement.
Here are the key takeaways:
- Asset prices are determined by the constant negotiation between buyers (demand) and sellers (supply).
- The Law of Demand states that demand rises as price falls, while the Law of Supply states that supply rises as price increases.
- The equilibrium price is where supply equals demand. A shortage (demand > supply) pushes prices up, and a surplus (supply > demand) pushes prices down.
- In practice, this happens through an order book. Price moves not just because of the number of buyers and sellers, but because of their aggressiveness.
- Aggressive market orders consume the passive limit orders waiting in the book, which is the direct cause of price change.
You saw in the final video that the order book is composed of bids (buy limit orders) and asks (sell limit orders). You also saw how a lack of orders (referred to as liquidity) could cause prices to jump or "gap."
In our next lesson, we will formalize these concepts. We will precisely define bid price, ask price, spread, and liquidity, and explain their profound impact on every single trade you will make.