Welcome to our third lesson. In our previous discussion, we delved into the mechanics of the order book, establishing that price moves when aggressive market orders consume the passive limit orders placed by other traders. We concluded by noting that this order book is fundamentally composed of bids from buyers and asks from sellers.
Today, we will precisely define these core concepts. Our goal is to define bid price, ask price, spread, and liquidity, and most importantly, to explain their direct and unavoidable impact on your trading. Understanding these elements is not just academic; it's the foundation of practical execution. Every time you enter or exit a trade, you will be interacting with bids, asks, and their resulting spread. Mastering these concepts will demystify many of the costs and apparent quirks of trade execution.
The Two Prices of Every Asset: Bid and Ask
In the last lesson, we saw that the order book is a list of buy and sell orders. For any liquid asset at any given moment, there isn't one single price, but two primary ones that matter for execution: the bid and the ask.
- Bid Price: This is the highest price a buyer in the market is currently willing to pay for an asset. Think of it as the "best" price you can get if you want to sell right now.
- Ask Price (also called the Offer Price): This is the lowest price a seller in the market is currently willing to accept for an asset. This is the price you must pay if you want to buy right now.
The Ask Price will always be higher than the Bid Price. The gap between them is fundamental to how markets function. This gap is called the Bid-Ask Spread.
Let's read a clear definition of these terms.
Bid-Ask Spread Explained: Formula, Example & Impact | Groww
This article from Groww, an Indian brokerage platform, provides concise definitions for these foundational terms.
Please read the section Meaning of Bid Price and Ask Price. Focus on this key sentence: "The bid price is what you get when you’re selling a security, while the ask price is what you pay when you’re buying a security."
The difference between the bid and ask is the spread. It represents the cost of immediacy. If you want to buy or sell instantly, you must "cross the spread," effectively paying this small cost.
The formula is simple:
This concept is visible on any trading platform. The image below shows a typical Forex trading interface for the USD/CHF pair. You can see two large prices: the "Sell USD" price (the Bid) and the "Buy USD" price (the Ask). The number in the middle, 0.9, represents the spread in pips (a term we'll cover later). Below, the "MARKET DEPTH" table shows the underlying limit orders that create these prices.
Visualizing the Spread: The Depth Chart
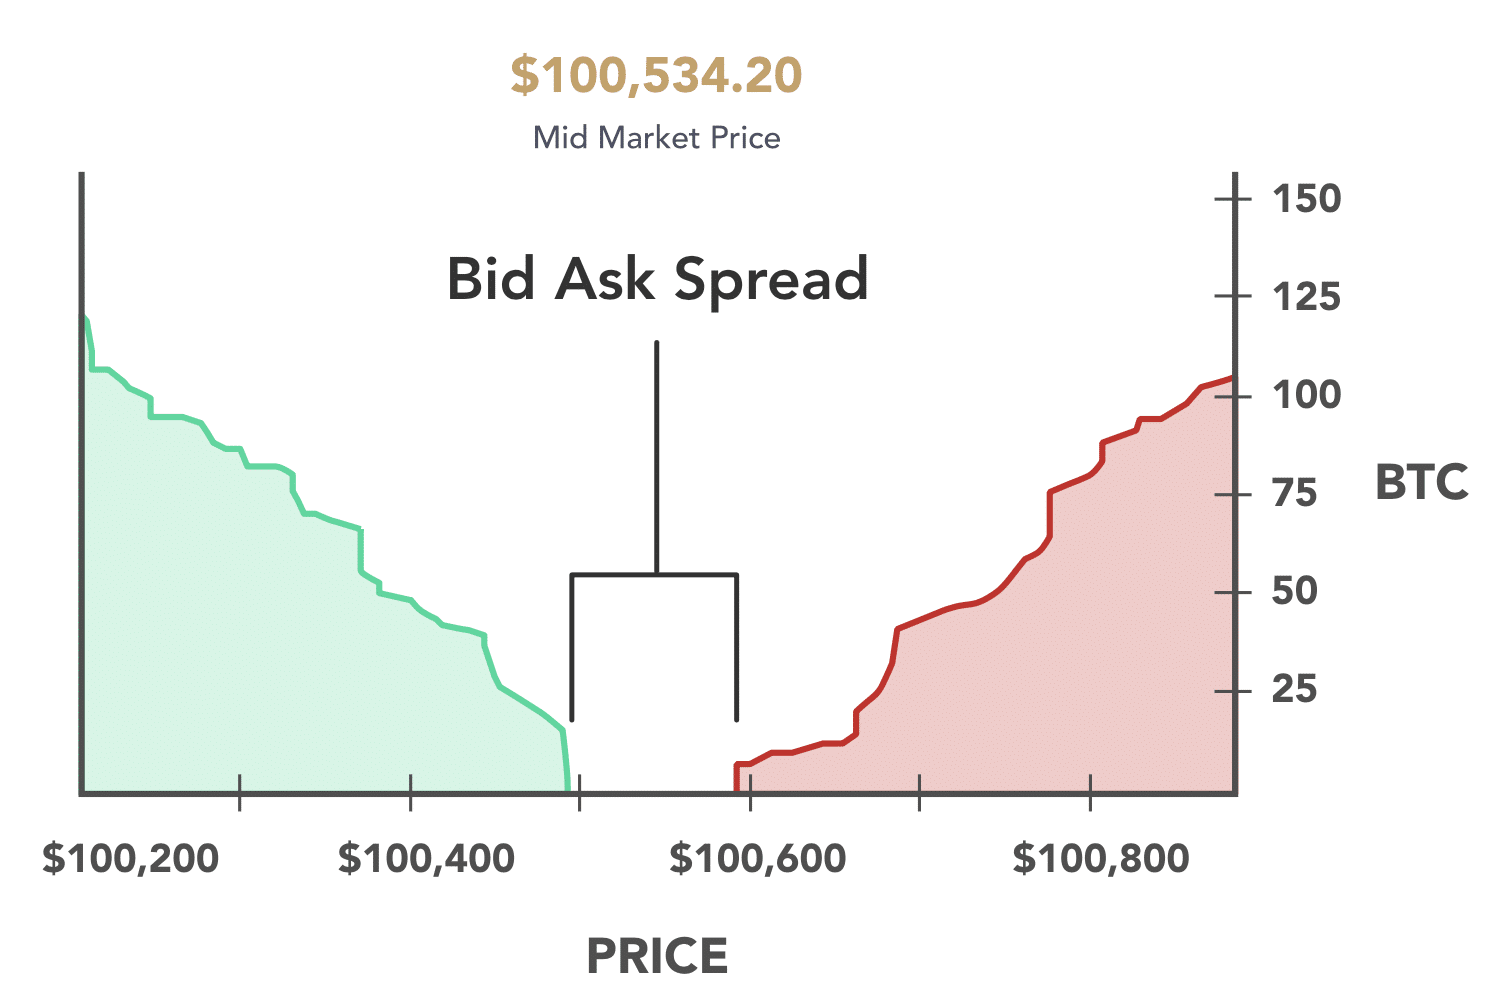
A powerful way to visualize the entire collection of bids and asks is through a depth chart. This chart plots all the buy orders (bids) and sell orders (asks) from the order book. Your physics background has trained you to interpret graphical data, and a depth chart is simply a graphical representation of the supply and demand we discussed in the last lesson.
- The green side shows the cumulative volume of bids at or below a certain price. This is the "demand wall."
- The red side shows the cumulative volume of asks at or above a certain price. This is the "supply wall."
- The gap in the middle is the bid-ask spread.
Liquidity: The Driver of the Spread
Why is the spread for Bitcoin on one day a few cents, while for a new, obscure altcoin it might be several dollars? The answer is liquidity.
Liquidity is a measure of how easily an asset can be bought or sold at a stable price. It’s a function of the number of market participants and the volume of orders in the order book.
- High Liquidity (a "liquid" market): Many buyers and sellers are actively trading. The order book is thick and deep. This leads to high competition, which forces the spread to be very narrow (or "tight"). Major assets like Bitcoin, EUR/USD, or blue-chip stocks like Reliance Industries are highly liquid.
- Low Liquidity (an "illiquid" or "thin" market): Few participants and sparse orders. This lack of competition allows for a much wider spread. Small-cap stocks, exotic currency pairs, or newly launched crypto tokens are often illiquid.
The relationship is inverse: High Liquidity = Tight Spread; Low Liquidity = Wide Spread.
To understand this better, let's explore an article that connects these concepts and shows how to compare spreads between different assets using a percentage calculation.
Bid-Ask Spread and Slippage Explained
This article from Binance Academy clearly explains the relationship between liquidity, volume, and the spread, using crypto markets for its examples.
Please read the following three sections: Start with the section What Is Bid-Ask Spread? It concisely links asset liquidity to the width of the spread. Next, read Depth Charts and Bid-Ask Spread. This reinforces the visual concept we just discussed. Finally, read the section Bid-Ask Spread Percentage. Pay close attention to the formula and the example comparing Bitcoin to a less liquid coin. This demonstrates why comparing the percentage spread is more useful than the absolute dollar value.
The video below offers a great summary, demonstrating how spreads differ across stocks, forex, and crypto, and visually showing the impact of liquidity.
What is Bid-Ask Spread? ✓ Bid Price vs Ask Price Explained ✓ Trading Crypto, Stocks & Forex
This video from Mind Math Money provides a clear, animated explanation of the concepts we've covered.
Watch the following segments: First, watch the initial definitions from the beginning to solidify your understanding of bid, ask, and spread. Then, skip to the section on market differences to see how typical spreads vary between stocks, forex, and crypto. Finally, watch from this point, where the narrator uses a calculator to vividly show how a high-liquidity market has a much tighter spread than a low-liquidity market.
The Real-World Impact on Your Trades
So far, this has been theoretical. Now, let's focus on what matters most for a trader: how does the spread directly affect your profit and loss?
- Entry Price: When you place a market order to buy, you are not filled at the mid-price you see on a chart; you are filled at the higher ask price. Your position starts with an immediate, small loss equal to half the spread.
- Stop-Loss Orders: The spread can trigger your stop-loss even if the price on the chart doesn't appear to touch it. Your broker's chart might show the mid-price or the bid price, but to exit a long position, your stop-loss order is triggered by the bid price. If the spread widens, the bid price can drop and hit your stop while the candle's low stays above it.
- Take-Profit Orders: The reverse is also true. For a long position to hit your take-profit target, the bid price must reach your target level. The price on the chart might briefly touch or even exceed your target, but if the bid price doesn't get there due to the spread, your order won't fill.
These scenarios are a common source of immense frustration for new traders. Understanding the mechanics of the spread is the key to avoiding this confusion.
The following video is one of the most practical you will see on this topic. It demonstrates these exact scenarios in the forex market.
What Are Spreads In Forex? (EVERYTHING YOU NEED TO KNOW)
The Trading Channel provides an excellent, no-nonsense demonstration of how spreads impact real trades.
Please watch these key demonstrations: First, watch the introduction on what spread is, where the host explains it's the broker's fee. Next, see how the spread affects your entry price, showing why your buy order is filled higher than you clicked. Then, watch the critical explanation of how spread can trigger your stop-loss prematurely. Finally, understand how spread can cause your profit target to be missed.
As a final related concept, slippage occurs when you try to execute an order, but due to market volatility or low liquidity, it gets filled at a different price than you expected. This often happens with large market orders in thin markets. As you "consume" all the orders at one price level, your order has to be filled by the remaining orders at the next, less favorable price level. This is a direct consequence of the order book dynamics we covered in the last lesson.
Conclusion
In this lesson, we have moved from the abstract order book to the concrete realities of trading costs and execution. These concepts are universal across equities, forex, and crypto.
Here are the key takeaways:
- Bid Price: The price where you can sell instantly.
- Ask Price: The price where you can buy instantly.
- Bid-Ask Spread: The difference between the Ask and the Bid, representing a fundamental transaction cost.
- Liquidity: The ease of trading an asset. It is the primary driver of the spread's width—high liquidity leads to tight spreads, and low liquidity leads to wide spreads.
- Impact on Trading: The spread directly affects your profitability by influencing your entry price and determining the true trigger points for your stop-loss and take-profit orders.
We've now established the static structure of the market (the bid and ask prices) and the forces that shape it (liquidity). In our next lesson, we will explore the dynamic tools you use to interact with this structure: the different types of orders. You will learn how to differentiate between market orders, limit orders, and stop-loss orders, giving you precise control over how you enter and exit the market.