Welcome to the fourth lesson of our "Foundations of Data Analytics" module. In our last session, we looked at the raw materials of analysis: the common data formats like CSV and JSON, and the sources where data lives, such as databases and internal HR or healthcare systems.
Today, we'll learn the recipe. The goal of this lesson is to describe the stages of the data analytics lifecycle, from question to deployment. Think of this as the strategic roadmap that every data analyst follows to transform raw data into valuable business action. Understanding this framework is crucial because it provides the structure for all the technical skills you'll be learning, from Excel and SQL to Python and Tableau. It's the "why" behind the "how."
1. What is the Data Analytics Lifecycle?
At its core, the data analytics lifecycle is a structured process for solving problems with data. While different organizations might label the stages slightly differently, the fundamental flow remains the same. It's a journey from identifying a business need to delivering an actionable solution.
Let's look at two common ways this process is visualized.
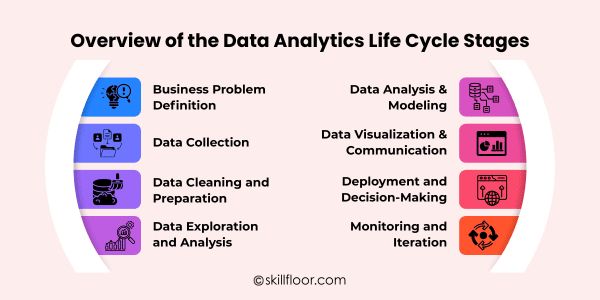
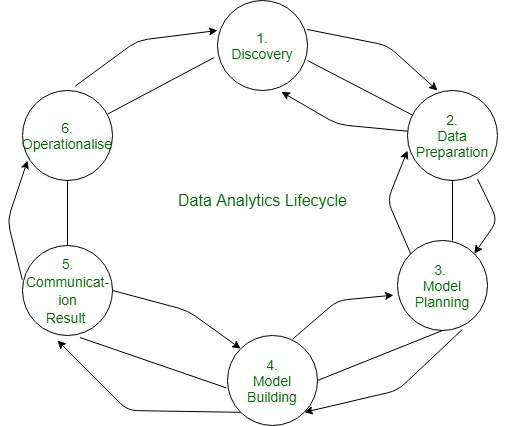
As you can see, both diagrams start with a problem or question and move through stages of data gathering, cleaning, analysis, and communication. The circular diagram emphasizes a key point: data analytics is rarely a one-and-done task. The insights from one project often spark new questions, starting the cycle all over again.
To get a quick, high-level overview of this entire process, let's watch a short video.
The Full Data Analysis Process Explained For Beginners
This video from the "Learn with Lukas" channel provides a clear, beginner-friendly walkthrough of the six core steps in the data analysis process.
Please watch the entire video from start to finish. As you watch, notice how each step logically follows the previous one, building a complete analytical project.
Now that you have a general sense of the flow, let's dive into each stage in more detail, connecting them to the real-world scenarios you're interested in, like healthcare and human resources. We will follow a common six-stage model.
2. The Six Stages of the Data Analytics Lifecycle
We'll use the excellent article "Data Analytics Lifecycle: From Discovery to Deployment" as our guide. It provides great context for each stage.
Data Analytics Lifecycle: From Discovery to Deployment
This article by Pooja Pawar breaks down the six key stages of the lifecycle, offering insights, examples, and pro tips for each. It's a great reference for understanding the end-to-end process.
Read through the article from the first stage to the conclusion. As you read, pay special attention to the examples provided for each stage, especially the healthcare one in "Model Building."
Let's walk through these stages, supplementing the reading with more context and examples.
Stage 1: Discovery (or Business Understanding)
As the reading highlights, every analytics project begins not with data, but with a question. This is arguably the most important stage. If you don't clearly define the problem you're trying to solve, your entire analysis, no matter how technically brilliant, will be useless.
In a professional setting, this involves talking to stakeholders—managers, department heads, clinicians, or HR leaders—to understand their goals and challenges.
Consider these examples relevant to your background:
- HR: A manager asks, "Why are we losing so many new hires in the first year?" The analyst's job is to refine this into a specific, measurable question like, "What are the key factors that correlate with employee turnover within the first 12 months of employment?"
- Healthcare: A hospital administrator wants to reduce costs. An analyst might help them frame the problem as, "Which patient populations have the highest readmission rates, and what are the primary drivers?"
The following video provides an excellent illustration of how the business context fundamentally shapes the data you'll need.
Data Analytics for Beginners | Analytics Lifecycle
This video from Six Sigma Pro SMART uses a simple but powerful example of a person named "Bob" in different scenarios (applying for a loan, getting insurance) to show how the "business understanding" dictates the "data understanding."
Watch the section from "business understanding and data understanding". Notice how the data required for Bob changes completely depending on whether he's at a bank, an insurance company, or a retail store. This is the discovery phase in action.
Stage 2: Data Preparation (Collection, Cleaning, and Transformation)
Once you know the question, you need the data. As we discussed in the last lesson, this data can come from anywhere—an export from an HRIS platform, a query from a hospital's patient database, or even external public health datasets.
This stage is often the most time-consuming, taking up to 80% of a project's time. The raw data is almost never ready for analysis. This is the "ETL" (Extract, Transform, Load) work we touched upon previously.
The data preparation phase involves several key tasks:
- Data Collection: Gathering the data from its sources.
- Data Cleaning: This is critical. It involves handling errors, inconsistencies, and missing information. For example, in an employee dataset, you might find some entries list the department as "Human Resources" and others as "HR." You need to standardize these. You might also find some employees are missing a start date, which you'd need to address.
- Data Transformation: Restructuring the data into a format suitable for analysis. This could involve joining an employee information table with a payroll table to have all the data in one place.
Stage 3: Model Planning & Building (Analysis)
With clean data in hand, the actual analysis begins. This stage is where you start exploring the data to find patterns and build models to answer your business question.
- Exploratory Data Analysis (EDA): You start by "getting to know" your data. You'll calculate summary statistics (like averages and counts, which we'll cover in Module 3) and create visualizations to spot trends, relationships, and outliers. For example, you might create a chart showing employee turnover by department to see if any stand out.
- Model Planning & Building: This is where you apply more formal statistical or machine learning techniques. The term "model" can sound intimidating, but it's just a way of mathematically representing a real-world process.
- For the HR turnover question, you might build a model to predict which employees are most likely to leave.
- For the healthcare question, the article you read mentioned a great example: building a model to predict hospital readmission rates.
Stage 4: Model Evaluation
After building a model, you need to verify its effectiveness. How accurate is your prediction? Does it perform well on new, unseen data?
A common technique, which the next video explains well, is to split your data. You use a majority of the data (e.g., 70%) to "train" your model, and then you use the remaining "test" data (30%) to evaluate how well it performs on data it has never seen before. This prevents the model from simply memorizing the training data and ensures it can make genuinely useful predictions.
Data Analytics for Beginners | Analytics Lifecycle
The same video provides a very clear, step-by-step explanation of partitioning data and evaluating a model's accuracy.
Please watch two clips from the video: First, watch the section on data partitioning. The analogy of a student solving new problems is a perfect way to understand the train/test split. Next, watch the section on model evaluation. It walks through a simple example of comparing the model's predictions to the actual results to calculate its accuracy.
Stage 5: Communicate Results
A perfect analysis is worthless if nobody understands it or acts on it. This stage is about translating your complex findings into a clear, compelling story for your stakeholders. This is often done through:
- Data Visualizations: Creating charts and graphs that make patterns easy to see. (We'll dedicate all of Module 9 to this using Tableau).
- Dashboards: Interactive reports that allow stakeholders to explore the data themselves.
- Presentations and Reports: Summarizing the key findings, the "so what" of your analysis, and providing actionable recommendations.
The key is to avoid jargon and focus on the business impact. Instead of saying "The p-value was less than 0.05," you would say, "We found a statistically significant link between a lack of manager check-ins and an employee leaving in their first year."
Stage 6: Operationalize (Deployment & Iteration)
The final stage is to put your insights and your model into action. This is called deployment or operationalization.
- A report might lead to a new HR policy for onboarding.
- A predictive model for patient readmission risk could be integrated directly into the Electronic Health Record system, flagging high-risk patients for follow-up care.
- A dashboard tracking employee satisfaction scores could be delivered to HR managers every month.
This is also where the "cycle" part comes in. After deployment, you monitor the results. Did the new HR policy reduce turnover? Did the patient alerts lower readmission rates? The results of this monitoring become the "Discovery" phase for the next round of analysis.
Conclusion
Today, we've outlined the entire end-to-end process that turns business questions into data-driven solutions. This lifecycle provides the strategic context for every technical skill you will learn in this course.
Here are the key takeaways:
- The Lifecycle is a Structured Framework: It provides a repeatable, six-stage process: Discovery, Data Preparation, Modeling, Evaluation, Communication, and Deployment.
- It Starts with the "Why": The most critical step is Business Understanding—clearly defining the problem before touching any data.
- Preparation is Key: Data cleaning and preparation is the most time-consuming but essential phase for ensuring reliable results.
- It's an Iterative Loop: The goal is not just to answer one question, but to create a continuous cycle of improvement where insights from one analysis fuel the questions for the next.
You now have the big-picture view of a data analyst's work. In our next lesson, we will look closer at the types of questions you can answer within this lifecycle by learning to distinguish between descriptive, diagnostic, predictive, and prescriptive analytics.