Welcome to the third lesson in our Foundations of Data Analytics module. In our last session, we explored the conceptual differences between structured, semi-structured, and unstructured data. You learned that while structured data fits neatly into tables, much of the world's information is less organized, existing as free-form text, images, or in hybrid formats.
Today, we will make these concepts concrete. The goal of this lesson is to identify common data formats and sources that you will encounter as a data analyst. We'll move from the "what" (the structure) to the "where" (the sources) and the "how" (the formats). We will examine specific file types like CSV and JSON, and discuss primary data sources such as databases, APIs, and the internal systems common in fields like healthcare and HR. Recognizing these is the first practical step toward acquiring and working with data.
1. From Structure to Format: CSV and JSON
In the previous lesson, we established that structured data is like a spreadsheet, and semi-structured data has some organization but is more flexible. Now, let's look at the actual file formats that represent these structures. The two most common formats you'll work with are CSV and JSON.
A great way to understand them is to see how they represent the exact same information.
Introduction to Common Data Formats (CSV, JSON)
This article from ApX Machine Learning provides clear, parallel examples of CSV and JSON, making the comparison very direct. It explains the structure, use cases, and limitations of each.
Please read the first two main sections of the article: Start with the section on CSV. Notice how it's just a text-based version of a table, perfect for structured data. Next, read the section on JSON. Pay close attention to the "key-value pair" structure and how it differs from the rigid rows and columns of CSV. This flexibility is what makes it ideal for semi-structured data.
Let's quickly summarize the key distinction you just read about:
- CSV (Comma-Separated Values): This is the ultimate format for structured data. It's a plain text file where each line is a row and commas separate the values in each column. You can think of it as the universal language for spreadsheets. If you need to get patient data out of an Electronic Health Record (EHR) system or employee data from an HR platform, exporting it as a CSV is almost always an option.
- JSON (JavaScript Object Notation): This is the go-to format for semi-structured data. It uses human-readable text to define data objects with "keys" (like column names) and "values" (the data itself). Its hierarchical, nested structure makes it far more flexible than CSV, which is why it's heavily used by web applications and APIs to exchange data.
As an analyst, you'll frequently receive data in one of these two formats. Being able to look at a file and immediately recognize its structure is a fundamental skill.
2. From Format to Source: Where Data Lives
Now that we've seen the common formats, let's zoom out and ask: where does this data actually come from? A data source is the origin, container, or system where data is stored and managed.
The modern world is saturated with data-generating activities. The image below provides a high-level view of the diverse origins of what we now call "Big Data."

As you can see, data relevant to your background in healthcare and HR comes from many places: medical records, patient data, and even data from internal business processes (Manufacturing/Retail). An analyst's job is to tap into these sources to extract meaningful information.
Let's explore the most common technical sources you'll work with.
Types of Data Sources - insightsoftware
This article from insightsoftware gives a great overview of the primary categories of data sources that businesses rely on.
Please read the following sections to understand the key sources: Databases: Understand that these are powerful, purpose-built systems for storing structured data, distinct from simple files. APIs: Grasp the concept of an API as a "bridge" for getting live data from other software. Flat Files: This section reinforces what we've learned, formally categorizing CSV, Excel, and JSON files as a type of data source. Other Data Sources: Note the mention of web scraping, which is another common method for data acquisition.
The reading covered several key sources. Let's organize them and add some context relevant to your goals:
- Flat Files: This is the simplest source. It includes the CSV, JSON, and Excel files that we've discussed. Often, data is extracted from a more complex system and delivered to you as a flat file.
- Databases: These are the workhorses of the corporate world. They are highly efficient systems for storing, retrieving, and managing vast amounts of data. You'll encounter two main types:
- Relational Databases (SQL): Store structured data in interconnected tables. Systems like patient registries or employee databases are built on these. You'll learn to query them with SQL in Module 5.
- NoSQL Databases: Store semi-structured or unstructured data and are more flexible. They are often used for web application data or large document repositories.
- APIs (Application Programming Interfaces): An API allows different software applications to talk to each other. For example, a hospital's scheduling software might use an API to pull physician availability from a separate HR system. Analysts use APIs to get live, up-to-date data, which is often delivered in JSON format.
- Internal Enterprise Systems: In your past roles, you've worked with the data produced by these systems.
- EHR/EMR Systems: Electronic Health/Medical Record systems are the central hub of patient data.
- HRIS (Human Resources Information Systems): Platforms like Workday or SAP SuccessFactors manage all employee data.
As an analyst, you typically don't work inside these systems but rather with data extracted from their underlying databases.
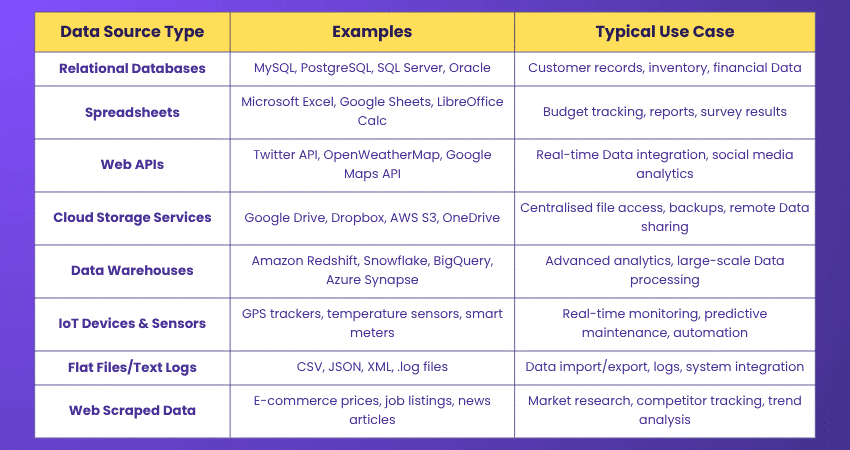
The table below provides a fantastic summary, connecting these source types to concrete examples and their typical use cases.
3. Putting It All Together: A Practical Workflow
So, how do these formats and sources interact in a real-world analytics task? Data rarely arrives in the perfect format from a single source. A crucial part of an analyst's job is to gather data from various sources and transform it into a clean, structured format suitable for analysis.
This process is often called ETL (Extract, Transform, Load).
- Extract: Pulling the raw data from its source (e.g., a JSON file from an API, a table from a database).
- Transform: Cleaning the data and converting it into a consistent, structured format (e.g., turning a complex JSON object into a simple table).
- Load: Loading the clean data into a final destination for analysis (e.g., a data warehouse or even just a pandas DataFrame in Python).
The following video provides a simple, clear explanation of this process using a hospital scenario—a perfect example connecting to your background.
ETL Made Simple | What Data Analysts Should Know
This video from Data Wizardry explains the concept of ETL using an easy-to-understand analogy and a relevant healthcare example.
Please watch from the beginning of the video. Pay close attention to how the narrator describes taking physician scheduling data, which might be in a format like JSON from an external app (Extract), and changing it into a tabular format (Transform) so it can be put into a SQL database (Load).
This ETL process is a fundamental concept in data analytics. It's the bridge that connects the messy reality of diverse data sources and formats to the clean, structured data required for analysis and visualization.
Conclusion
In this lesson, we demystified where data comes from and what it looks like. You now have a practical framework for identifying the most common ways data is stored and exchanged.
Here are the key takeaways:
- Common Formats: CSV is the standard for structured, tabular data, while JSON is the standard for semi-structured, hierarchical data often found on the web.
- Common Sources: Data analysts acquire data from various sources, including simple flat files, powerful databases, live APIs, and internal business systems like EHRs and HR platforms.
- Connecting Sources and Formats: The ETL (Extract, Transform, Load) process is the workflow used to gather data from different sources, convert it into a usable format, and prepare it for analysis.
You now understand the raw materials of data analytics. In our next lesson, we will step back and look at the bigger picture: the data analytics lifecycle. We will outline the complete, end-to-end process that analysts follow to turn a business question into an actionable insight.