Welcome to your first lesson in the Foundations of Data Analytics. This course is designed to build your skills from the ground up, equipping you for a successful transition into a data analyst role. Today, we'll start with the absolute fundamentals: the language used to describe data.
By the end of this lesson, you will be able to define key concepts like datasets, variables, and the different types of data. Understanding this core vocabulary is the essential first step before you can analyze, visualize, or interpret any information. Whether you're examining patient outcomes, employee performance metrics, or clinical trial results, these concepts are the universal building blocks.
1. The Anatomy of a Dataset
At its heart, data analytics is about finding meaningful patterns in collected information. This information is typically organized into a dataset. For most of your work as an analyst, this will mean a structured table, much like a sheet in Excel.
A dataset has a few key components.
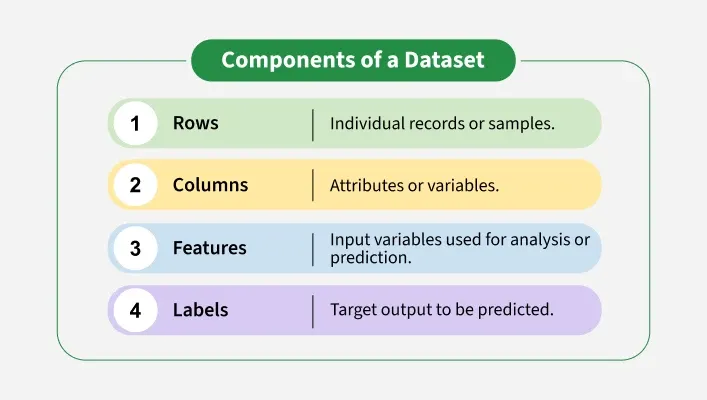
Let's define these terms:
- Rows: Each row represents a single, individual record of what is being studied. In statistics, this is often called a case or an observation. In your field, a case could be one patient, one employee, or one specific clinical visit.
- Columns: Each column represents a specific attribute or characteristic measured for each case. This is what we call a variable. For a patient (the case), the variables might be their age, blood pressure, and diagnosis.
- Features & Labels: These are terms you'll often hear in machine learning, but they relate directly to variables. Features are the input variables we use for analysis (like a patient's symptoms and vitals). A Label (or target) is the specific output variable we want to understand or predict (like whether the patient recovered).
To make sense of any new dataset, analysts start by asking three fundamental questions. This framework helps establish the context needed for any meaningful analysis.
2.1. Data Set Structure and Variable Types — STAT 350
This reading from a statistics course at Purdue University introduces the basic structure of a dataset and the "Who, What, Why" framework for examining data.
Please read the section titled "Understanding the Structure of a Data Set". As you read, focus on how the terms case and variable relate to the rows and columns of a spreadsheet and internalize the three fundamental questions.
Applying this to your background, imagine a dataset from a Human Resources department:
- Who? The cases are the individual employees of the company.
- What? The variables could be Department, Job Title, Salary, Years of Service, and Performance Rating.
- Why? The goal might be to understand if there is a relationship between years of service and performance ratings, or to check for salary disparities between departments.
This simple "Who, What, Why" check is your first tool for orienting yourself with any data you encounter.
2. Classifying Variables: A Critical Skill
Once you've identified the variables in a dataset, the next crucial step is to classify them. Why? Because the type of a variable determines the kind of questions you can ask, the calculations you can perform, and the charts you can create. For example, you can calculate the average age of patients, but you can't calculate the average blood type.
The following video provides a clear and concise overview of the main types of variables you will encounter.
Types of Variables - Numerical vs. Categorical - Discrete vs. Continuous - Ordinal vs. Nominal
This video from the "Medicosis Perfectionalis" channel gives a dynamic introduction to the primary classification of variables.
Please watch from the beginning until the main overview. The presenter will walk you through the two main families of variables and their sub-types with simple, memorable examples.
As the video explained, variables fall into two main families: Quantitative (Numerical) and Qualitative (Categorical). You may see these terms used interchangeably in different resources, but they refer to the same concepts.
Qualitative (Categorical) Variables
These variables describe a quality or characteristic and place a case into a category or group. They don't represent a measurable quantity.
- Nominal: These are categories with no natural order or ranking. Examples from a healthcare context include:
- Blood Type (A, B, AB, O)
- Patient Gender (Male, Female, Other)
- Drug Manufacturer (Pfizer, GSK, Novartis)
- Ordinal: These are categories that have a meaningful order or ranking, but the "distance" between categories is not necessarily equal or measurable. Examples include:
- Pain Scale (Mild, Moderate, Severe)
- Patient Satisfaction Survey (Very Dissatisfied, Dissatisfied, Neutral, Satisfied, Very Satisfied)
- Disease Stage (I, II, III, IV)
Quantitative (Numerical) Variables
These variables represent a measured or counted quantity. Arithmetic operations like addition and averaging make sense with these variables.
- Discrete: These variables can only take on specific, separate values (often integers). They are typically things you count. Examples include:
- Number of daily admissions to a hospital
- Number of pills in a bottle
- Number of employees in a department
- Continuous: These variables can take on any value within a given range. They are typically things you measure. Examples include:
- Patient height or weight
- Blood pressure in mmHg
- Concentration of a drug in a blood sample (mg/L)
- Time taken to complete a task
To deepen your understanding, let's turn to a more detailed resource that's specifically tailored to your interest in health sciences.
Types of Data | Biostatistics for the Health Sciences - Pharmacy 180
This article from Pharmacy180.com provides definitions and excellent, relevant examples of data types from a biostatistics perspective.
Please read the sections on Qualitative Data and Quantitative Data. Note how the examples align with concepts from your pharmacy background.
A common point of confusion is distinguishing between discrete and continuous variables. The "STAT 350" resource offers a helpful mental trick called the "Next Value" test. For any numerical value, ask yourself: "Can I clearly identify the next possible value?"
- If a hospital has 30 patients, the next possible value is unambiguously 31. You can't have 30.5 patients. Since the next value is well-defined, this is a discrete variable.
- If a patient's temperature is 37.5°C, what's the next possible value? Is it 37.6°C? What about 37.51°C, or 37.501°C? Since there are infinite possibilities between any two measurements, the next value is not clearly defined. This is a continuous variable.
3. Deeper Distinctions and Practical Implications
Now that you have the main classifications, let's explore two more concepts that add nuance and connect these ideas to the practical work of a data analyst.
Independent vs. Dependent Variables
In many analyses, our goal is to understand relationships. We often theorize that one variable influences or causes a change in another.
- Independent Variable: The variable that is changed or controlled in an experiment to test its effects on the dependent variable.
- Dependent Variable: The variable being tested and measured in an experiment, which is 'dependent' on the independent variable.
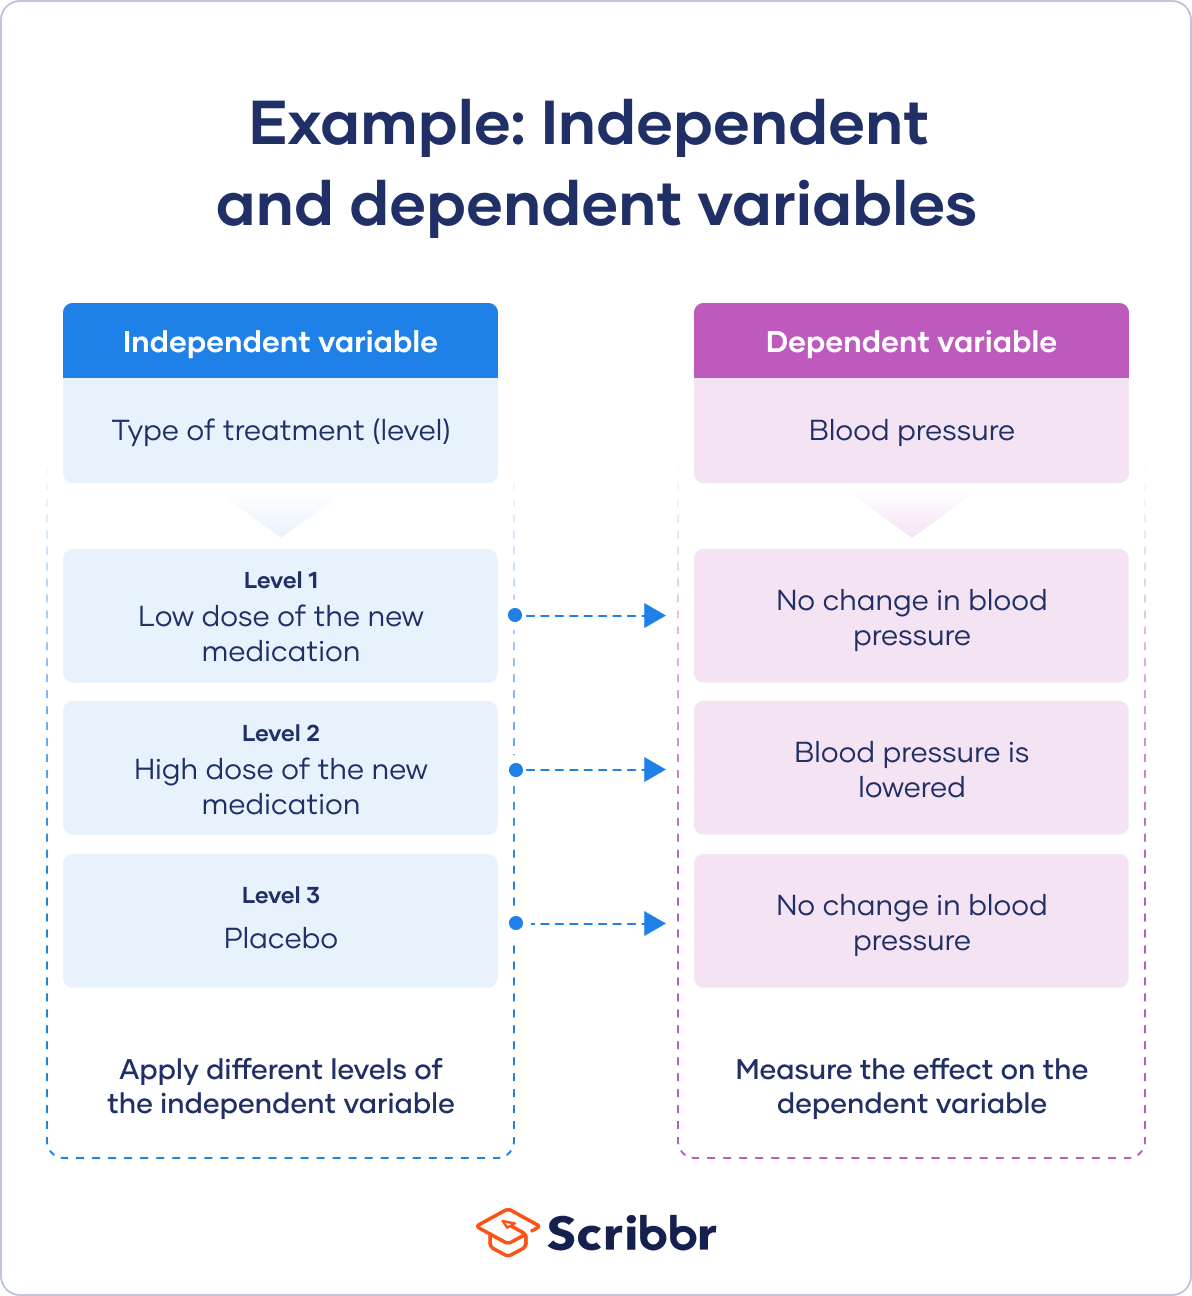
As an analyst, you'll constantly be looking for these relationships. For example, in an HR context, you might investigate if the training program (independent variable) affects employee performance score (dependent variable).
Data Types in Computing
Why do we care so much about these classifications? Because the tools we use—from Excel to Python to SQL—need to know what kind of data they are dealing with. A computer can't "average" a list of names because they are stored as text, not numbers.
This final video bridges the statistical theory of variable types with the practical concept of "data types" in computer systems.
What are Data Types? | Data Fundamentals for Beginners
In this video, "Alex The Analyst" explains why data types are fundamental for any data work, connecting the concepts to how computer systems interpret values.
Watch the entire video, which is quite short (full video). Pay close attention to how he groups data types into strings (text), numbers, and dates, and how each type enables different kinds of analysis.
This video introduces a critical point: statistical variable types map onto data types in software.
- Qualitative variables (Nominal, Ordinal) are typically stored as string (text) data.
- Quantitative variables (Discrete, Continuous) are stored as numeric data types, like
IntegerorFloat(a number with decimals). - Dates and times are their own special category with unique properties.
Getting the data type right is a fundamental part of data cleaning, a topic we will explore in great detail later in this course.
Conclusion
In this introductory lesson, we have laid the groundwork for your entire data analytics journey. You've learned how to approach and understand the structure of a dataset and, most importantly, how to classify the data within it.
Here are the key takeaways:
- A dataset is a collection of information, typically organized in a table where rows are individual cases and columns are variables.
- The "Who, What, Why" framework is your first step in understanding any new dataset.
- Variables are primarily classified as Qualitative/Categorical (describing qualities) or Quantitative/Numerical (representing amounts).
- Categorical variables can be Nominal (no order) or Ordinal (ordered).
- Numerical variables can be Discrete (countable) or Continuous (measurable).
- The type of a variable dictates the analysis you can perform, and this is reflected in how computers store data (e.g., as strings, integers, or dates).
So far, we have only discussed data that fits neatly into tables, known as structured data. In our next lesson, we will broaden our perspective to explore other common forms of data you'll encounter as an analyst: semi-structured and unstructured data.