Hello! Welcome back to our course on customer analytics.
In our last lesson, we focused on data cleaning, ensuring our transaction dataset is free from critical missing values and duplicates. We now have a reliable, event-level dataset where each row represents an item within a transaction.
While this is a great foundation, to understand customer behavior, we need to shift our perspective from individual transactions to the customers themselves. A business manager isn't interested in the 50,000th transaction; they want to know: "Who is customer #12347, and how do they behave compared to others?"
This lesson is all about answering that question. We will aggregate transaction data to create customer-level summaries. We'll transform our long list of individual purchases into a concise, powerful profile for each customer, summarizing their buying habits. This process is a cornerstone of customer analytics, enabling everything from segmentation to churn prediction.
1. The Core Idea: Split-Apply-Combine
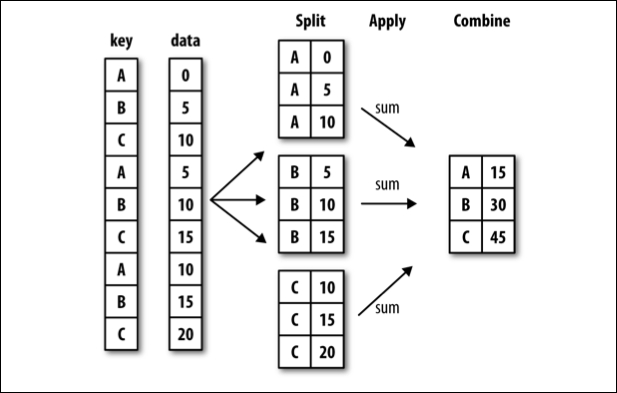
The fundamental task is to roll up our transaction data into a customer-level view. To do this, we'll use a powerful data manipulation strategy known as Split-Apply-Combine.
- Split: We break our large dataset into smaller groups based on a specific key. In our case, we'll group all transactions by
CustomerID. - Apply: We apply a function to each group independently. For example, we could sum the
TotalAmountfor each customer's group of transactions or count how many transactions they made. - Combine: We merge the results of these functions into a new DataFrame, where each row represents a summary of a single group (i.e., a single customer).
The following diagram illustrates this process perfectly.
2. The Tool for the Job: groupby() in pandas
In pandas, the "Split" step is handled by the .groupby() method. This method is one of the most powerful tools in a data scientist's toolkit for data analysis.
When you call df.groupby('CustomerID'), pandas doesn't immediately show you a new table. Instead, it creates a special GroupBy object. This object contains all the information needed to then "Apply" functions to each customer's group of data.
To get a better intuition for what this object represents and the overall concept of grouping, the following video provides a clear and concise introduction.
Python Pandas Tutorial (Part 8): Grouping and Aggregating - Analyzing and Exploring Your Data
This video from Corey Schafer's renowned pandas tutorial series will help you build a solid mental model of what grouping means and how groupby() works.
Watch from 12:50 to 18:21. The key things to focus on are: The explanation of the 'Split-Apply-Combine' process. The idea that df.groupby('Country') creates a GroupBy object containing multiple groups. How get_group() can be used to inspect one of these individual groups. This helps solidify what 'splitting' the data actually does.
3. Creating Customer Summaries with .agg()
Once we've grouped our data, we need to perform the "Apply" and "Combine" steps. We often want to apply different summary functions to different columns. For example:
- We want to sum the
TotalAmount. - We want to count the number of unique
InvoiceNo. - We want to find the most recent
InvoiceDate.
The .agg() method is designed for precisely this situation. It allows you to pass a dictionary specifying which aggregation function to apply to which column. This is a clean, efficient, and highly readable way to create customer summaries.
The article below provides a fantastic, business-focused walkthrough of this exact process.
EDA in Public (Part 3): RFM Analysis for Customer Segmentation in ...
This article from Towards Data Science, 'EDA in Public (Part 3): RFM Analysis', demonstrates a professional workflow for creating customer summaries. It shows the exact groupby().agg() pattern we need.
Read the sections 'Engineering the RFM Metrics' and 'Aggregating Transactions at the Customer Level'. Pay close attention to the groupby().agg() code block. We'll break it down next.
Deconstructing the .agg() Method
Let's look at the code from the article. It's a powerful one-liner that accomplishes our entire goal.
# Assuming 'df' is our cleaned transaction data and 'snapshot_date' is defined
rfm = df.groupby('CustomerID').agg({
    'InvoiceDate': lambda x: (snapshot_date - x.max()).days,
    'InvoiceNo': 'nunique',
    'Revenue': 'sum'
})
Let's break this down piece by piece:
df.groupby('CustomerID'): As we learned, this splits the data into groups for each customer..agg({ ... }): This tells pandas to apply the functions defined in the dictionary to each group.'Revenue': 'sum': For each customer group, calculate the sum of theRevenuecolumn. This gives us the total monetary value.'InvoiceNo': 'nunique': For each group, count the number of unique values in theInvoiceNocolumn. This gives us the purchase frequency, correctly handling cases where one invoice contains multiple items.'InvoiceDate': lambda x: ...: This is the most advanced part.lambda x:defines a small, anonymous function. Here,xwill be the Series ofInvoiceDatevalues for a single customer group.x.max()finds the most recent purchase date within that customer's transaction history.(snapshot_date - x.max()).dayscalculates the number of days between a reference date (snapshot_date) and the customer's last purchase. This metric is known as Recency.
This single command efficiently executes the entire Split-Apply-Combine strategy, producing a new DataFrame where each row is a customer and the columns are their summary metrics.
4. A Practical Walkthrough
Now let's see this in action. The following video implements a very similar aggregation to create a customer summary table for RFM (Recency, Frequency, Monetary) analysis. Watching someone code this will help solidify your understanding.
Data Science Project - RFM model
In this video, 'Data Science Project - RFM model', Karina a Data Scientist performs the exact aggregation we've been discussing. This will serve as a great practical reinforcement of the concepts.
Watch from 06:08 to 09:05. Focus on: How she uses groupby('CustomerID').agg({...}) to calculate Recency, Frequency, and Monetary value. Note the slight difference: she uses 'count' for InvoiceNo. Using 'nunique' (as in the article) is often more accurate for purchase frequency, but both are valid approaches depending on the data structure. Observe the final step where she renames the columns for clarity, which is a crucial best practice.
5. Interpreting the Customer Summary
You've successfully transformed your data. You now have a DataFrame where each row is a customer, indexed by CustomerID, with columns like Recency, Frequency, and Monetary.
This isn't just a technical exercise; this new table is a powerful business tool. It allows you to answer critical questions at a glance.
The Towards Data Science article you read earlier has an excellent section on how to interpret this new DataFrame from a business perspective.
EDA in Public (Part 3): RFM Analysis for Customer Segmentation in ...
Let's revisit the Towards Data Science article to understand the business value of our new customer summary table.
Read the section titled 'Inspecting the Result'. Notice how the author translates the raw numbers for each customer into a business story. This is the crucial link between data science and business strategy.
By creating and interpreting this summary, you can start to identify different types of customers: the recent, frequent, high-spenders; the one-time big purchasers who have since gone silent; and the loyal but low-spending regulars.
Conclusion
Congratulations! You have mastered one of the most fundamental transformations in customer analytics: moving from a transactional view to a customer-centric view.
Key Takeaways:
- Aggregation's Goal: To change the unit of analysis from transactions to customers, creating a summary profile for each one.
- The Conceptual Model: The "Split-Apply-Combine" strategy is the mental framework for all aggregation tasks.
- The Pandas Toolkit:
df.groupby()is your tool for the "Split" step.df.agg()with a dictionary is the flexible and powerful method for the "Apply" and "Combine" steps, allowing different functions for different columns.
- The Business Value: The resulting customer-level DataFrame is not the end of the analysis but the beginning. It enables you to understand customer behavior, identify valuable segments, and make data-driven decisions.
In our next lesson, we'll make our customer profiles even richer. We will learn how to merge multiple data sources, combining our newly created transaction summary with other information, such as customer demographics, to build a truly comprehensive 360-degree view of each customer.