Hello! Welcome back to the course.
In our last lesson, we loaded a customer transaction dataset and performed an initial inspection. Using methods like .info(), you likely noticed some challenges that are common in real-world data: missing values, especially in the CustomerID column, and the potential for duplicate entries.
Today's lesson addresses this head-on. We'll tackle the essential process of handling missing values and duplicates in customer data. This is a critical step in the data science lifecycle. The quality of our analysis and any models we build depends entirely on the quality of our data. As the saying goes, "garbage in, garbage out." For customer analytics, this means we can't analyze a customer's behavior if we don't know who they are (missing ID) or if we're accidentally counting their purchases multiple times (duplicates).
By the end of this lesson, you'll have the practical pandas skills to clean your dataset, making it a reliable foundation for the analysis to come.
1. The Strategy for Missing Data
Missing data can skew your analysis, lead to errors, and reduce the statistical power of your findings. In customer data, a transaction record with a missing CustomerID is an anonymous event; it can't be used to understand the behavior of a specific person. Our first task is to identify, quantify, and strategically handle these gaps.
Step 1: Find and Quantify Missing Values
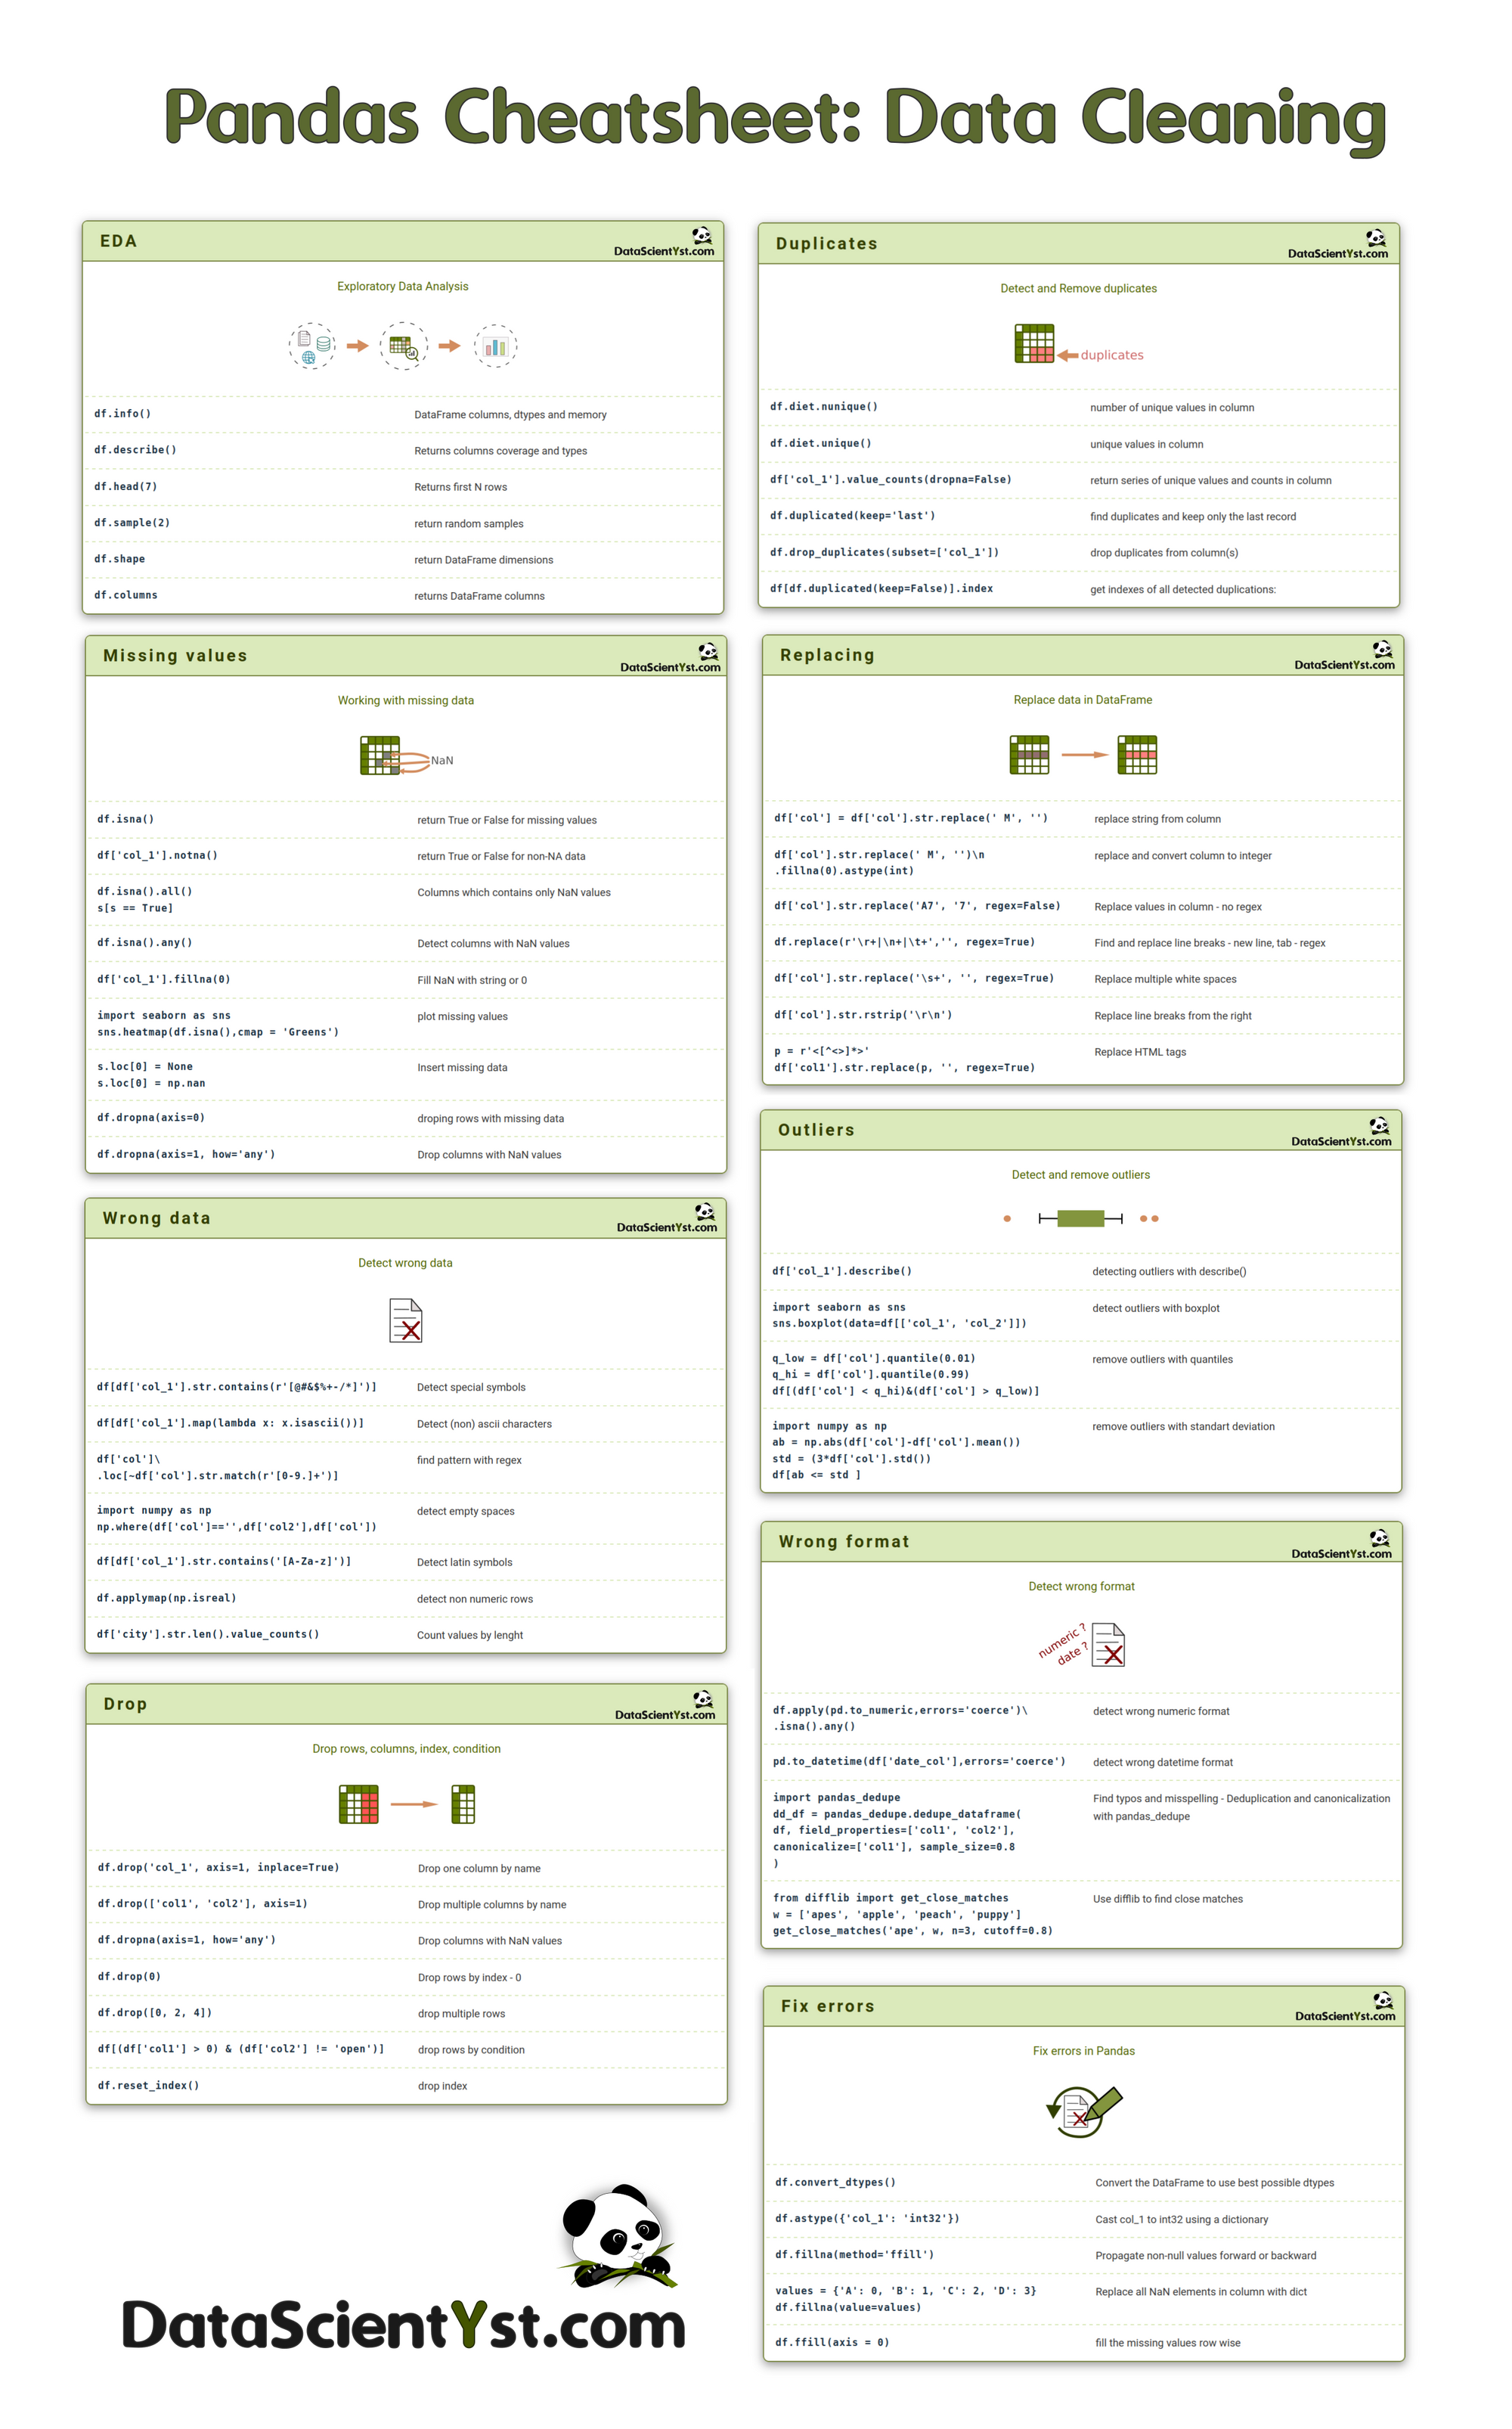
In the previous lesson, .info() gave us a first glance at missing data. A more direct way to quantify the problem is to use the .isnull() method combined with .sum().
# To get a count of nulls in each column
df.isnull().sum()


# To see this as a percentage of the total rows
(df.isnull().sum() / len(df)) * 100
This simple command gives you a clear report card on your data's completeness and helps you prioritize which columns to fix.
The following video provides an excellent, structured walkthrough of how to approach missing data, from quantification to deciding on a strategy.
Step-by-Step Data Cleaning with Python | Python Pandas Tutorial
This video from Data Analytics Lab demonstrates a professional workflow for handling missing data. You'll see how to first assess the extent of the problem and then choose an appropriate solution for different scenarios.
Watch from 03:58 to 10:51. Focus on the thought process: 1. Calculate the percentage of missing values. 2. Based on the percentage and the column's importance, decide whether to drop the column, fill the missing values, or drop the affected rows.
Step 2: Choose Your Handling Strategy
As the video shows, there isn't a single best way to handle missing data. The choice depends on the context. Here are the most common strategies:
A. Dropping Rows with Missing Values
This is the most suitable option when a piece of data is essential for your analysis. In our case, CustomerID is non-negotiable for customer analytics. Without it, the transaction can't be linked to a person.
- When to use: When a critical column has missing values, and the number of affected rows is a small percentage of your total dataset.
- How to do it in pandas:
The# Drops all rows where 'CustomerID' is NaN (Not a Number) df.dropna(subset=['CustomerID'], inplace=True)inplace=Trueargument modifies the DataFrame directly. Be careful with it; it's often safer to assign the result to a new DataFrame (df_clean = df.dropna(...)) to keep a copy of the original.
B. Dropping Columns with Missing Values
Sometimes, a column is so empty that it provides little to no information. If that column isn't crucial for your planned analysis, the best approach is often to remove it entirely.
- When to use: When a column has a very high percentage of missing values (e.g., > 50-60%) and is not essential for your goal.
- How to do it in pandas:
# Drops the entire 'PromotionalCode' column
df.drop(columns=['PromotionalCode'], inplace=True)
C. Imputing (Filling) Missing Values
If a column has some missing values but is still useful, you can fill the gaps. This is called imputation.
- When to use: For non-critical columns where you want to retain the rows for other analyses.
- Common Imputation Techniques:
- Fill with a constant: For categorical data, you might fill with "Unknown". For numerical data, filling with 0 or -1 can act as a distinct category.
df['Description'].fillna('No Description', inplace=True)- Fill with a statistic: For numerical columns, you can use the mean, median, or mode. The median is often preferred as it's less sensitive to outliers.
# Fills missing 'Age' values with the median age
median_age = df['Age'].median()
df['Age'].fillna(median_age, inplace=True)
The DataCamp article below provides a great textual summary and further examples of these techniques.
Data Cleaning: Understanding the Essentials
For a detailed written guide on handling missing data, refer to this section from the DataCamp article 'Data Cleaning: Understanding the Essentials'.
Read the subsection titled 'Missing data'. It covers visualizing missing data, calculating percentages, and the core strategies of dropping versus imputing, reinforcing what you saw in the video.
2. Tackling Duplicate Data
Duplicate records can artificially inflate key business metrics like sales volume, purchase frequency, and customer counts. Removing them is crucial for accurate reporting and analysis.
Step 1: Identify and Remove Full Duplicates
A full duplicate is a row where all column values are identical to another row. These are almost always data entry or system errors.
- How to find them:
# Returns the number of fully duplicated rows df.duplicated().sum() - How to remove them:
# Drops all fully duplicated rows, keeping the first instance by default
df.drop_duplicates(inplace=True)
This quick video demonstrates this simple but powerful function.
Data Cleaning in Pandas | Python Pandas Tutorials
The following clip from 'Data Cleaning in Pandas' by Alex The Analyst provides a quick and clear demonstration of removing full duplicates.
Watch from 02:38 to 03:37 to see df.drop_duplicates() in action.
Step 2: Identify and Remove Duplicates Based on Specific Columns
More commonly, a row isn't a full duplicate but is considered a duplicate based on a specific set of key columns. For example, two rows with the same CustomerID, InvoiceNo, and StockCode at the exact same InvoiceDate are very likely a single transaction recorded twice.
This is where the subset parameter comes in.
10 Pandas One-Liners for Data Cleaning - KDnuggets
This article from KDnuggets shows how to use the subset parameter, which is essential for intelligently removing duplicates in transaction data.
Read point #8, 'Remove Duplicates Based on Specific Columns'. This explains how drop_duplicates(subset=...) allows you to define what constitutes a 'duplicate' in your business context.
Using this, you can define your own business logic for uniqueness:
# Defines a duplicate as a row with the same InvoiceNo and StockCode
df.drop_duplicates(subset=['InvoiceNo', 'StockCode'], keep='first', inplace=True)
The keep parameter lets you decide which of the duplicates to keep ('first', 'last', or False to drop all duplicates).
3. A Quick Note on Data Types
After handling missing values, it's a good practice to re-check your data types using df.info(). Sometimes, missing values (which are technically floats) can cause a column of integers to be read as a float column.
Once the NaNs are gone, you can easily convert the column to the correct type. Since your background includes programming, you'll recognize this as a form of type casting.
# Convert CustomerID from float to integer after dropping NaNs
df['CustomerID'] = df['CustomerID'].astype(int)
This ensures that when we perform calculations later, the data is in the expected format.
Conclusion
In this lesson, you've moved from simply inspecting data to actively cleaning it—a fundamental skill for any data scientist.
Key Takeaways:
- Cleaning is a strategic process: Don't just blindly delete data. Follow a workflow: identify issues, quantify their impact, and choose a handling strategy (drop or impute) that aligns with your business goal.
- Handle missing data with context: For customer analytics, dropping rows with missing
CustomerIDs is often necessary to ensure the integrity of your customer-level analysis. - Define duplicates intelligently: Use
drop_duplicates()to remove simple errors anddrop_duplicates(subset=...)to apply business logic for what constitutes a unique record. - Data types matter: Always verify and correct your data types after cleaning to prevent unexpected errors in later steps.
Now that our data is clean—with no critical missing values and no duplicate transactions—we can finally start summarizing it to understand our customers. In the next lesson, we will aggregate this transaction data to create customer-level summaries, turning a long list of individual purchases into a concise profile for each customer.