Hello! Welcome to your first lesson in the Customer Analytics course.
Given your background in data science theory, this course is designed to help you bridge the gap to practical, business-focused applications. We'll start from the ground up, building the skills you need to analyze customer behavior and drive business decisions.
Today's lesson is the essential first step in any data project: loading and inspecting a customer transaction dataset using the pandas library in Python. This is the foundation upon which all customer analytics, from segmentation to churn prediction, is built. By the end of this lesson, you'll be able to take a raw data file and confidently perform the initial exploration that every data scientist does to understand its structure, contents, and quality.
Let's get started.
1. Your Toolkit: An Introduction to Pandas and DataFrames
In Python, the pandas library is the primary tool for data manipulation and analysis. Its core data structure is the DataFrame, which you can think of as a highly powerful version of a spreadsheet or a SQL table, organized into rows and columns. It's built to handle real-world data, which is often messy and incomplete.
Almost every data science project in Python begins with import pandas as pd. The pd is a standard, community-agreed-upon alias that makes your code easier to read.
The first step is always to load your data from a file (most commonly a CSV) into a DataFrame. To see a quick demonstration of what pandas is and how to load a simple CSV file, the following video provides an excellent starting point.
Learn Pandas in 30 Minutes - Python Pandas Tutorial
Watch this segment from 'Learn Pandas in 30 Minutes' by Tech With Tim to get a foundational overview of pandas, DataFrames, and how to load a CSV file.
Watch the first 4 minutes and 13 seconds (00:00 - 04:13). Focus on the concepts of a DataFrame and the pd.read_csv() function.
2. Loading Real-World Customer Data
Now, let's apply this to a realistic customer transaction dataset. We'll be working with a dataset that contains transactions for a UK-based online retailer. This is exactly the kind of data you'd encounter in a business setting when tasked with analyzing customer behavior.
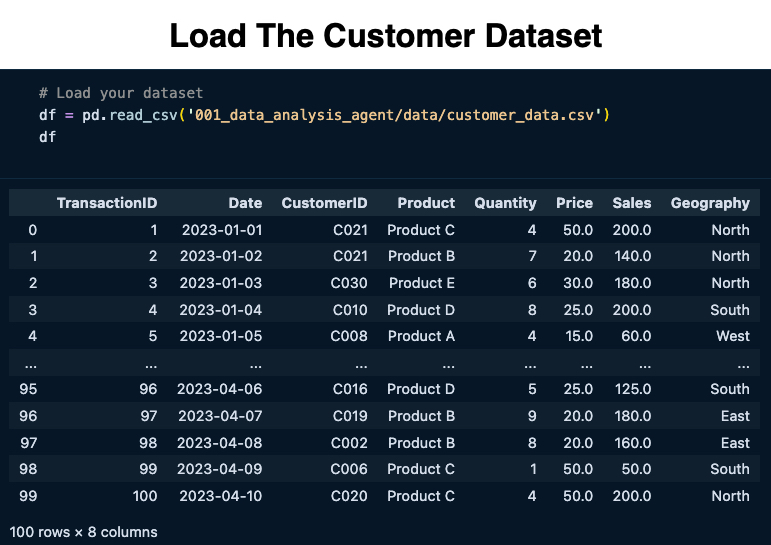
The article below provides an excellent, business-focused walkthrough of loading and exploring this dataset. It introduces the data and then shows the code to load it.
EDA in Public (Part 1): Cleaning and Exploring Sales Data with ...
This article, 'EDA in Public (Part 1)', will be our guide for this initial phase. It uses a real-world online retail dataset and frames the analysis from a business perspective.
Read the sections 'Dataset Overview' and 'Data Loading and Slicing'. Pay attention to the description of the data columns and the use of pd.read_csv() to load the file into a DataFrame.
Notice the code in the article uses an encoding='unicode_escape' argument. This is a great example of a practical issue you'll face. Sometimes files have special characters that require you to specify the encoding type to be read correctly.
Fine-Tuning Your Data Import
The pd.read_csv() function is very powerful and has many parameters to handle different file formats and loading scenarios. While you don't need to memorize them all, knowing a few key ones is extremely useful.
The following article from DataCamp provides a clear tutorial on read_csv().
pandas read_csv() Tutorial: Importing Data - DataCamp
This 'pandas read_csv() Tutorial' provides a great summary of the most useful parameters for loading data.
Skim through the sections 'Importing a CSV file', 'Setting a column as the index', and 'Selecting specific columns'. Then, review the table under 'Common read_csv() parameters'. Focus on understanding what sep, usecols, parse_dates, and header do.
Being able to use parameters like usecols (to select specific columns) and parse_dates (to automatically convert date columns) can save you memory and time right from the start.
3. The Initial Inspection Checklist
Once your data is loaded into a DataFrame, you should immediately perform a few checks. This is a standard routine to quickly understand the dataset's size, structure, and quality.
Let's watch a demonstration of the most common inspection methods.
Learn Pandas in 30 Minutes - Python Pandas Tutorial
This segment from 'Learn Pandas in 30 Minutes' covers the essential methods for your initial data inspection.
Watch from 11:01 to 13:27. This will show you live examples of using .head(), .tail(), .info(), and .describe().
Now, let's solidify this by reading through the same process in the article we started with.
EDA in Public (Part 1): Cleaning and Exploring Sales Data with ...
The 'Initial Data Inspection' section of the article walks through this exact checklist, interpreting the output in a business context.
Read the section 'Initial Data Inspection: Getting Our Hands Dirty'. Pay close attention to the questions the author asks and how each method (.head(), .info(), .describe()) helps answer them.
Here is a summary of the key inspection methods and the business questions they help answer:
-
.shape:- What it does: Returns a tuple representing the dimensions of the DataFrame (rows, columns).
- Business Question: "How large is this dataset? How many transactions and features do we have?"
-
.head()and.tail():- What they do: Show the first and last 5 rows of the DataFrame, respectively.
- Business Question: "Did the data load correctly? What do the values in each column look like at a glance?"
-
.info():- What it does: Provides a concise summary of the DataFrame, including the number of non-null values and the data type (Dtype) for each column.
- Business Question: "Do we have missing data in important columns like
CustomerID? Are columns like dates and numbers stored in the correct format?"

.describe():- What it does: Generates descriptive statistics for the numerical columns (e.g., count, mean, min, max, quartiles).
- Business Question: "What is the range of our sales prices and quantities? Are there any strange values, like negative prices, that might indicate data errors or specific events like returns?"
By running these four methods, you can quickly build a mental model of your dataset and identify potential issues that need to be addressed before any analysis can begin.
Conclusion
In this lesson, you've taken the first crucial step in any customer analytics project. You've learned how to use pandas to load transaction data and how to perform a systematic initial inspection.
Key Takeaways:
- Pandas is your primary tool: The pandas library and its DataFrame object are fundamental for data analysis in Python.
- Loading data is step one:
pd.read_csv()is the go-to function for importing tabular data, with powerful options to handle various formats. - Inspection is not optional: A standard inspection routine using
.shape,.head(),.info(), and.describe()is essential to understand your data's structure, identify missing values, check data types, and spot potential anomalies. - Connect to the business: Always think about what the output of your code means in a business context. Missing
CustomerIDs impact your ability to track individual shoppers, and negativeQuantitymight represent product returns.
This process of loading and inspecting data invariably reveals issues that need fixing. In our next lesson, we will tackle this head-on by learning how to handle missing values and duplicates in customer data, moving us one step closer to a clean dataset ready for analysis.