Hello! Welcome back to our Mathematics Mastery Sprint.
In our last lesson, we built a strong foundation in probability, learning how to calculate probabilities for single and combined events using the 'AND' and 'OR' rules. We saw how tree diagrams are an excellent tool for structuring these problems, especially when dealing with dependent events.
Today, we'll continue our work in the Probability and Statistics module by exploring another powerful visual tool: Venn diagrams. Venn diagrams are essential for solving problems involving overlapping sets of data. We'll learn how to construct them from written information and, crucially, how to use them to calculate probabilities. Our main focus will be on conditional probability, which is the probability of an event happening given that another event has already occurred.
By the end of this lesson, you will be able to use Venn diagrams to represent sets and calculate probabilities, including conditional probability.
1. The Language of Venn Diagrams: Sets and Notation
A Venn diagram uses overlapping circles inside a box to represent how different sets of data relate to each other.
- The box (labelled with ) represents the universal set, which contains every element being considered.
- Each circle represents a specific set (e.g., students who study Physics).
- The overlapping area (intersection) shows elements that belong to both sets.
- The area outside the circles shows elements that belong to neither set.
To describe regions precisely, we use set notation:
- Intersection (): means 'A and B'. This is the overlapping region.
- Union (): means 'A or B (or both)'. This includes everything in circle A, circle B, and their overlap.
- Complement ('): means 'not A'. This is everything outside of circle A.
The following video provides an excellent introduction to interpreting this notation and shading the correct regions in a Venn diagram. This is a common type of question in Paper 2.
Everything you need to know about IGCSE Sets and Venn Diagrams in 38 minutes
Watch this clip from the Ginger Mathematician's video on Sets and Venn Diagrams. It covers how to interpret set notation and describe shaded regions, which is a fundamental skill.
First, watch from the beginning to 4:01 to understand the basics of set notation with three circles. Then, watch from 10:08 to 14:10, where the presenter systematically breaks down how to shade more complex regions like 'Q or not P' and 'K or L and not M'. This methodical approach is key to avoiding errors.
2. Constructing Venn Diagrams from Word Problems
A major exam skill is taking information from a paragraph and using it to fill in a Venn diagram. The key strategy is to always work from the inside out. Start with the information that applies to the most specific region (usually the central intersection) and build outwards.
Case 1: The Intersection is Known
This is the most straightforward scenario. The problem directly tells you the number of elements that belong to all sets involved.
Problem Solving with Venn Diagrams (Harder Venn Diagrams!) | Grade 7-9 Playlist | GCSE Maths Tutor
This clip from The GCSE Maths Tutor provides a clear, step-by-step example of how to fill in a two-circle Venn diagram when you are given the value for the intersection ('both').
Watch from 0:43 to 4:13. Pay close attention to how the number for 'only Cat' is found by subtracting the 'both' value from the total for 'Cat'. This is a critical step.
Case 2: The Intersection is Unknown (Algebraic Method)
This is a more challenging and common Paper 4 style question. When you don't know the value of the central intersection, you must assign it a variable (like ) and use algebra to form an equation. This is a perfect example of where you can apply your algebraic skills to solve a problem that initially seems to be about probability.
Problem Solving with Venn Diagrams (Harder Venn Diagrams!) | Grade 7-9 Playlist | GCSE Maths Tutor
The same video now explains the algebraic method required when the intersection is unknown. This is a key strategy for tackling higher-mark questions.
Watch from 4:13 to 7:51. Follow the logic of labelling the intersection as 'x', writing the other sections in terms of x (e.g., 24 - x), and then forming an equation by summing all sections to equal the total.
Test your understanding!
Here is an image of a past-paper style question. Before looking at the provided solution, try to solve it yourself using the algebraic method you just learned.
- Question: In a class of 30 students, 19 study Physics (P), 17 study Chemistry (C), and 15 study both or neither. Find the number of students who study neither subject.

Show answer
- Let the number of students studying both Physics and Chemistry be . This is .
- The number of students studying only Physics is .
- The number of students studying only Chemistry is .
- The number of students studying neither is given as part of the "15" total. Let's call this value . The question states that 15 study both or neither, so , which means .
- The sum of all sections must equal the total number of students (30):
Substitute :
- Simplify and solve for :
This seems incorrect, a number of students must be an integer. Let's re-read the question in the image. Ah, the image text says "15 students study at least one of the subjects". Let's try again with the correct information from the image.
Corrected Solution based on the image's text:
- Let .
- .
- .
- We are told the total number of students who study at least one subject is 25 (since 5 study neither, and there are 30 students total). The "at least one" part is the union, .
- The sum of the three circle regions must be 25:
- Simplify and solve for :
- Therefore, 11 students study both. This matches the worked solution in the image.
This is a great example of how carefully reading the question is vital!
3. Calculating Probability with Venn Diagrams
Once the Venn diagram is correctly filled, calculating probabilities is straightforward. Remember the basic formula:
The "number of favorable outcomes" is the number in the relevant region of the diagram, and the "total number of outcomes" is the total number of elements in the universal set ().
Conditional Probability
Conditional probability questions use phrases like "given that" or "if you select a student who studies Geography, find the probability that...". This phrase tells you to restrict the sample space. Instead of the total being everyone (), the new total is just the number of elements in the "given" set.
For example, to find the probability of A given B, written :
Let's read a concise explanation and then see it applied in a worked example.
Conditional Probability - Cambridge (CIE) IGCSE Maths
This page from Save My Exams gives a formal definition of conditional probability and then provides a clear worked example using a Venn diagram.
Read the sections 'What is a conditional probability?' and the 'Worked Example'. Notice in the example how the denominator becomes the total number of elements in set B (5), not the total in the universal set.
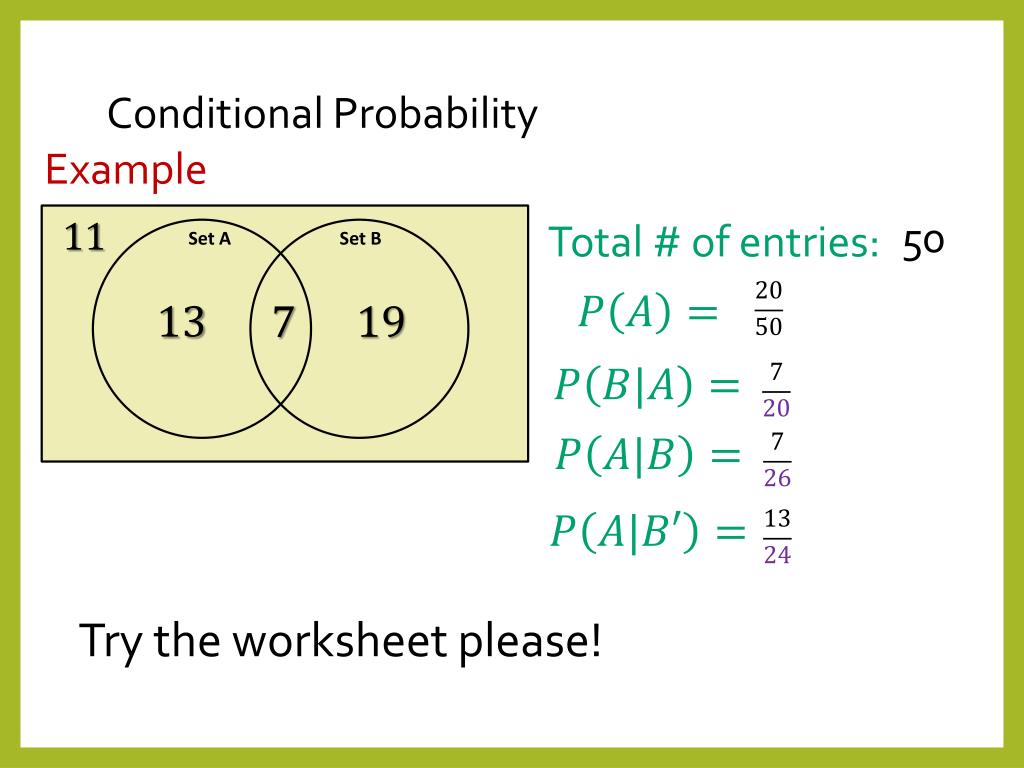
Now let's watch a video that brings everything together: constructing a challenging three-circle Venn diagram and then using it to calculate a conditional probability.
Problem Solving with Venn Diagrams (Harder Venn Diagrams!) | Grade 7-9 Playlist | GCSE Maths Tutor
This is a high-level walkthrough from The GCSE Maths Tutor. It involves constructing a complex three-circle diagram and then calculating a probability for successive events without replacement, which is a form of conditional probability.
Watch from 9:32 to 18:13. This is a long clip, but it's an excellent model for a top-grade answer. Pay special attention to the language used ('but do not like milk' vs 'like coffee and milk') and how that affects which numbers are placed where. The probability calculation at the end is a classic dependent event problem, similar to what we saw in the last lesson.
Conclusion
Great job working through this topic. Venn diagrams are a fundamental part of the IGCSE syllabus, and mastering them is crucial for questions that combine set theory with probability.
Key Takeaways:
- Venn diagrams are a visual method for organizing data into sets and identifying overlaps.
- Always work from the inside out when filling in a diagram. If the intersection is unknown, use algebra by setting the intersection to .
- For basic probability, use the number in the desired region as your numerator and the total number of elements () as your denominator.
- For conditional probability ("given that..."), your new denominator is the total of the "given" set. You are working within a restricted sample space.
Preview of the Next Lesson:
In our next lesson, we will focus on using tree diagrams to model successive events and calculate probabilities. While we touched on this in the previous lesson, we will now tackle more complex scenarios, ensuring you can confidently choose and use the best method—tree diagram or Venn diagram—for any given probability problem.