Hello! Welcome to the first lesson in our module on "Process and Service Management with systemd".
In the previous modules, you've built a solid foundation in managing users and permissions. You now know how to control who can do what on your Fedora system. Now, we'll shift our focus to managing what your system is actually doing—the running programs, or processes, that carry out every task.
This lesson introduces a fundamental tool for any system administrator or developer: the ps command. Think of it as the command-line equivalent of the Task Manager on Windows or Activity Monitor on macOS. It gives you a snapshot of what's running, who started it, and what resources it's consuming. For your goal of deploying Django applications, ps will be your first stop when you need to answer questions like: "Is my Gunicorn application server running?", "Did the Nginx web server start correctly?", or "What's the Process ID of my database so I can inspect it further?".
By the end of this lesson, you will be able to use ps to list and inspect the processes running on your system, which is the first step in diagnosing almost any server-side issue.
1. What is a Process?
Before we dive into the command, let's clarify what we're looking at. A process is simply an instance of a computer program that is being executed. When you launch a program (like Firefox, your terminal, or a Python script), the operating system creates one or more processes to run it.
Each process is assigned a unique number called a Process ID (PID). This PID is how the system keeps track of and manages each process. You'll use PIDs frequently to monitor or control specific processes.
The ps command (short for Process Status) works by reading information from a special virtual filesystem located at /proc. This directory contains a numbered subdirectory for every single process running on your system, and ps formats that information into a human-readable table.
2. The Basic ps Command
Let's get our hands dirty. Open your terminal and run the ps command with no options:
ps
You'll see a very short list—probably just bash (your shell) and the ps command itself. This is because, by default, ps only shows the processes associated with your current terminal session. While this has its uses, it's not the full picture.
To understand this basic output, let's watch a short video.
Linux Crash Course - The ps Command
This clip from the "Linux Crash Course" series by Learn Linux TV clearly explains the purpose of ps and breaks down the columns you see in its default output.
Watch from 00:05 to 03:50. Focus on understanding the meaning of the four default columns: PID, TTY, TIME, and CMD. Note the key takeaway: ps by itself only shows processes from your current session.
3. Getting the Full Picture: ps aux
To see everything running on your system—background services, processes from other users, and system daemons—we need to add options. There are different styles of options for ps (UNIX, BSD, GNU), which can be confusing. For now, we'll focus on the most popular and useful combination, which uses the BSD style (no dashes): ps aux.
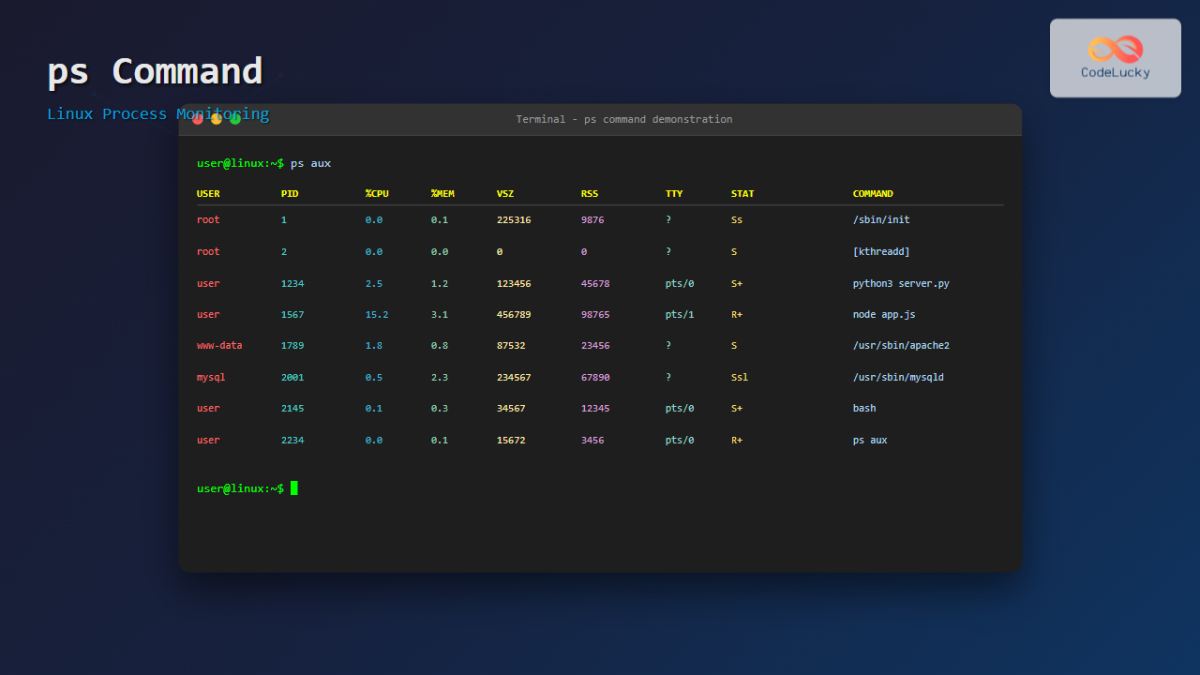
Let's break down what aux means:
a: Show processes for all users.u: Display in a user-oriented format (with more useful details).x: Include processes not attached to any terminal (like background services).
This command gives a much richer output with several important new columns. The article below provides an excellent explanation of each one.
ps Command Explained – Track, debug, and manage Linux processes
To make sense of the ps aux output, it's crucial to understand each column. The article "ps Command Explained" from webdock.io has a fantastic breakdown of this.
Read the section titled "Basic ps Syntax" and the detailed breakdown of the ps aux output that follows it. Focus on understanding what the a, u, and x flags do, and what each column (especially USER, PID, %CPU, %MEM, RSS, STAT, and COMMAND) represents. This is the core knowledge for this lesson.
The key columns for you as a developer will often be:
USER: Who owns the process? (e.g.,root, your username,apache).PID: The unique Process ID.%CPU: The percentage of CPU the process is using.%MEM: The percentage of RAM the process is using.RSS: Resident Set Size, the actual physical memory used (a more concrete number than%MEM).COMMAND: The full command that launched the process.
When your Django application is slow, checking the %CPU and %MEM for your python, gunicorn, or nginx processes will be your first diagnostic step.
4. Do-It-Yourself: Finding Your Processes
Theory is one thing, but let's put this into practice. The output of ps aux can be very long. To find what you're looking for, you'll almost always combine it with another command, grep, to filter the results.
We'll cover pipes (|) and grep in detail in a later module, but for now, just know that | takes the output of the command on its left and "pipes" it as the input to the command on its right.
So, ps aux | grep httpd means "get the status of all processes, then search through that output for lines containing 'httpd'".
Step 1: Start a Background Process
Since you are studying Python, let's use Python's built-in web server. The & at the end tells the shell to run the command in the background, so you get your terminal prompt back immediately.
python3 -m http.server &
You'll see a message like [1] 12345, where 12345 is the PID of your new process.
Step 2: Find Your Python Process
Now, use ps and grep to find the web server you just started.
ps aux | grep python
You should see at least two lines. One is your python3 -m http.server process. The other is the grep python process itself (since it was running at the moment ps took its snapshot!).
- Examine the output: Who is the
USER? Does thePIDmatch the one you saw when you started it? How much CPU and memory is it using?
Step 3: Find a System Process
In the previous lesson, you worked with the Apache web server, httpd. Let's see if it's running.
ps aux | grep httpd
You'll likely see several httpd processes. This is normal for web servers like Apache. One is the main root process, and the others are "worker" processes (often owned by the apache user) that handle incoming requests. This parent-child structure is a common pattern you'll see.
Step 4: Clean Up
You can stop the simple Python web server by finding its PID and using the kill command (which we'll cover in more detail later). First, find the PID again if you forgot it:
ps aux | grep 'http.server'
(Using a more specific search term helps avoid the grep process itself).
Once you have the PID (e.g., 12345), use kill:
kill 12345
This hands-on exercise is the bread and butter of process inspection on Linux.
Conclusion
Great job! You've learned how to peek under the hood of your Linux system and see what's going on. This is a foundational skill for both system administration and web development troubleshooting.
Key Takeaways:
- A process is a running instance of a program, each with a unique Process ID (PID).
psprovides a snapshot of running processes.psby itself is limited; options are required for a complete system view.ps auxis the most common command to see all processes with user-friendly details likeUSER,%CPU, and%MEM.- Combining
pswithgrep(e.g.,ps aux | grep nginx) is the standard way to find a specific process.
You've learned how to take a static snapshot of your processes. But what if you need to watch resource usage change in real-time to catch a problem as it happens?
In the next lesson, we will explore top and htop, dynamic tools that give you a live, refreshing view of your system's activity. This is perfect for identifying which process is suddenly consuming all your CPU or memory.