Hello! Welcome back.
In our last lesson, you learned how to use the ps command to take a static "snapshot" of the processes running on your system. This is an essential skill for seeing what's running at a specific moment in time. However, when you're troubleshooting performance issues—like a slow website or an unresponsive server—you often need to see how resource usage changes in real-time. A static snapshot just won't cut it.
This lesson introduces two powerful, dynamic tools: top and htop. Think of ps as a photograph of your system's activity, while top and htop are like a live video feed. As a future web developer, these tools will be indispensable for diagnosing why your Django application might be slowing down, identifying memory leaks, or pinpointing a specific function that's consuming all your CPU power.
By the end of this 60-minute lesson, you will be able to monitor your system's resources and identify processes by their CPU and memory usage using both the classic top command and its modern successor, htop.
1. The Classic Monitor: top
The top command is a standard utility found on virtually every Linux and Unix-like system, including your Fedora installation. Because it's always available, knowing how to use it is a fundamental skill for any system administrator or developer.
To get started, simply open your terminal and run the command:
top
You'll see a full-screen display that updates every few seconds. It can look intimidating at first, so let's break it down. The screen is split into two main parts:
- The Summary Area (Top): The first five lines provide a high-level overview of your system's health.
- The Process List (Bottom): A detailed list of running processes, sorted by CPU usage by default.
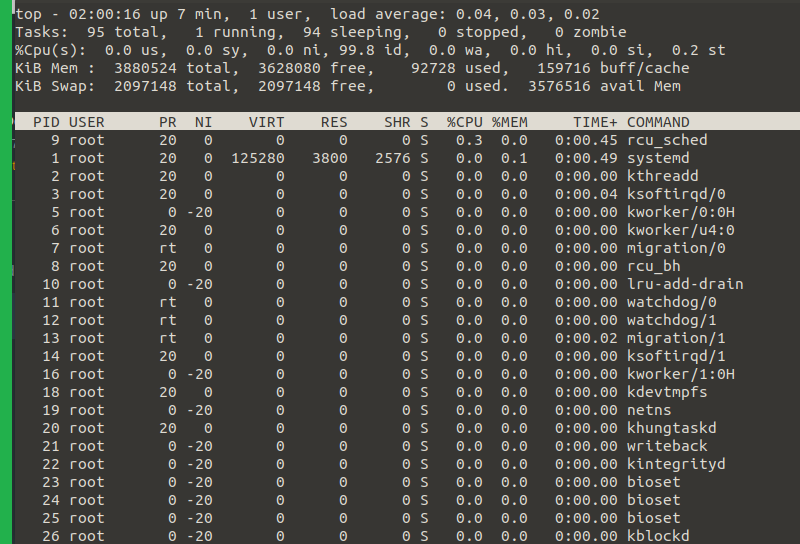
To understand what all this information means, let's watch a video that provides a clear and detailed explanation.
process monitors for Linux - comparing top and htop
The video "process monitors for Linux" by BlueMonkey 4n6 offers an excellent walkthrough of the top command's output. Watching this will help you decipher each part of the summary and process list.
Watch the segment from 01:26 to 07:42. Pay close attention to the breakdown of the five summary lines (uptime, tasks, CPU, memory, swap) and the meaning of the key columns in the process list, such as PID, USER, %CPU, and %MEM.
After watching the video, you should be familiar with the layout. Here are the most common interactive commands you'll use while top is running:
q: Quit and return to the terminal prompt.P(Shift + p): Sort the process list by Processor (%CPU) usage (this is often the default).M(Shift + m): Sort the process list by Memory (%MEM) usage.u: Filter the list to show processes owned by a specific user.topwill prompt you for the username.c: Toggle theCOMMANDcolumn between showing just the process name and the full command path with arguments.k: Kill a process.topwill prompt you for the PID of the process you want to terminate.1(the number one): Toggle the CPU usage display between a single, aggregated summary and a separate line for each CPU core.
For a more comprehensive list of commands, the "Using top" section in the OneUptime article is a great reference to bookmark.
2. The Modern Successor: htop
While top is powerful and ubiquitous, htop is an enhanced, more user-friendly alternative that many developers and sysadmins prefer. It presents the same information but in a more visually intuitive way, with color-coding, graphical meters, and full mouse support.
Installing htop
htop is not always installed by default, but it's readily available in Fedora's repositories. To install it, use the dnf package manager you learned about previously:
sudo dnf install htop
The installation process is also covered in the following video.
This clip from the "Linux Crash Course" series by Learn Linux TV will quickly show you how to get htop installed on a Fedora-based system.
Watch from 04:21 to 06:18. The video covers installation on different Linux families. Focus on the sudo dnf install htop command mentioned for Fedora/Red Hat systems.
Exploring the htop Interface
Once installed, run htop from your terminal:
htop
You'll immediately notice the differences:
- Visual Meters: Graphical bars at the top show usage for each CPU core, memory, and swap space.
- Color Coding: Makes it easy to distinguish between different types of processes and resource usage levels.
- Mouse Support: You can click on column headers to sort, scroll through the process list with your mouse wheel, and click on processes to select them.
- Function Key Menu: A helpful menu at the bottom of the screen shows you all the available actions, mapped to the F1-F10 keys.
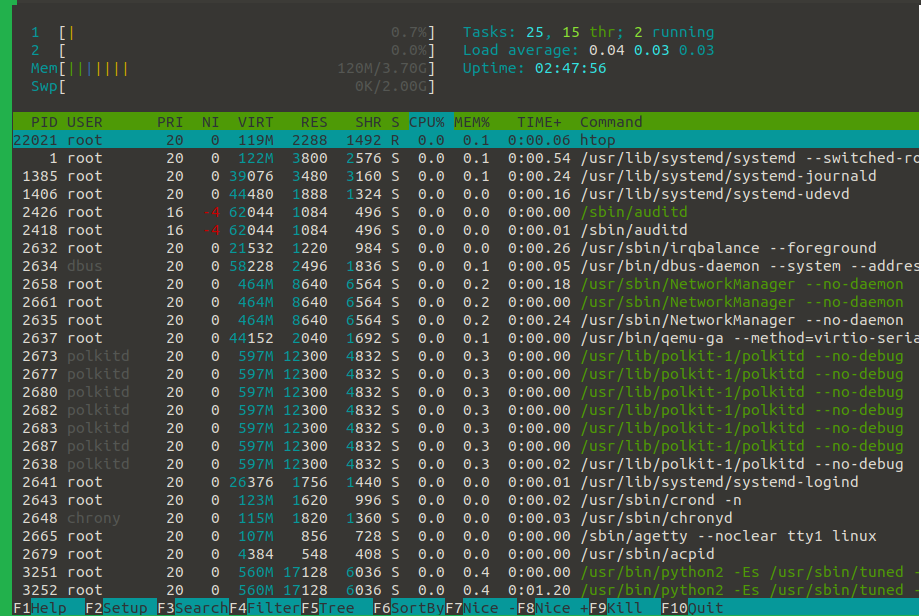
Let's explore some of the most useful features of htop.
process monitors for Linux - comparing top and htop
Let's return to the BlueMonkey 4n6 video, which also provides a great introduction to htop's key features, such as sorting, searching, and filtering.
Watch from 07:42 to 12:32. This segment will guide you through using the mouse, sorting by clicking columns, and using the F3 (Search), F4 (Filter), and F5 (Tree view) functions.
Here's a summary of the most important htop functions:
F10,q: Quithtop.F6(or mouse click): Sort by a specific column. A menu will appear letting you choose.F3: Search for a process by name. It will highlight the first match.F4: Filter the list, showing only processes whose command contains the text you enter.F5: Toggle Tree view, which shows parent-child relationships between processes. This is very useful for web servers like Nginx or Apache, which spawn worker processes.F9: Kill a process. This brings up a menu of signals you can send to the selected process.F2: Setup menu, where you can customize meters, columns, and colors.
The OneUptime article, "How to Handle System Monitoring with top and htop," has a great table under the section Comparing top vs htop that summarizes the key advantages of htop.
3. Do-It-Yourself: Hunting a Runaway Process
Now it's time to put this knowledge into practice. A common scenario you'll face as a developer is a "runaway script"—a piece of code stuck in an infinite loop that consumes 100% of a CPU core. Let's simulate this and use top and htop to find and fix the problem.
Step 1: Create the Runaway Script
Open a text editor and create a file named busy_script.py with the following content. This simple script creates an infinite loop that will max out one of your CPU cores.
# busy_script.py
print("Starting a busy loop...")
while True:


    # This loop does nothing but consume CPU time
    pass
Save the file.
Step 2: Run the Script
In your terminal, run the script in the background using the & symbol. This will start the process and immediately give you your terminal prompt back.
python3 busy_script.py &
Step 3: Hunt the Process with top
- Launch
top. - You should see a
python3process at or near the top of the list, with a%CPUvalue close to 100.0. - Press
1to see the per-core CPU usage. You'll notice that one core is maxed out while others are relatively idle. - Note the PID of the
python3process from the first column. - Press
kto activate the kill prompt.topwill suggest a PID to kill (usually the top one). - Type the PID of your
python3script and press Enter. At the next prompt, just press Enter again to send the defaultSIGTERMsignal. - The
python3process will disappear from the list. - Press
qto exittop.
Step 4: Hunt the Process with htop
Let's do it again, this time with the more user-friendly tool.
- Start the script again in the background:
python3 busy_script.py & - Launch
htop. - The
python3process should be at the top of the list, highlighted and showing high CPU usage on one of the meters. - Use your arrow keys or mouse to ensure the
python3process is selected (highlighted). - Press
F9to bring up the "Kill" menu. - The default signal,
15 SIGTERM, is already selected. Press Enter to send it. - The process will be terminated and vanish from the list.
- Press
F10orqto quit.
This exercise demonstrates the core workflow for identifying and dealing with resource-intensive processes—a vital skill for maintaining a healthy server.
Conclusion
Congratulations! You've moved beyond static snapshots and can now perform live monitoring of your system's health. You've learned to use both the universally available top and the feature-rich htop to keep an eye on your server's performance.
Key Takeaways:
topandhtopprovide a real-time, dynamic view of running processes and system resource usage.topis the classic, pre-installed tool. Key commands includePfor CPU sort,Mfor memory sort, andkto kill.htopis a modern, user-friendly alternative with colors, graphs, and mouse support. Key functions includeF6(Sort),F4(Filter), andF9(Kill).- Both tools are essential for diagnosing performance bottlenecks by identifying processes with high CPU or memory consumption.
In this lesson, you used the interactive "kill" functions in top and htop. These are convenient shortcuts for a more fundamental Linux concept: sending signals to processes. In our next lesson, we will dive deeper into this, learning how to use the kill and killall commands directly to terminate, pause, and control processes with precision.